alteredcoast

Observations of coastal erosion and sea on East Anglian Coast

Altered Coast is a documentation through images and words of coastal erosion on the coast of East Anglia. Locations, sediment, weather systems, communities, tides and surges as actors in a constantly changing, increasingly fragile evolution. As restless and powerful as the sea itself.
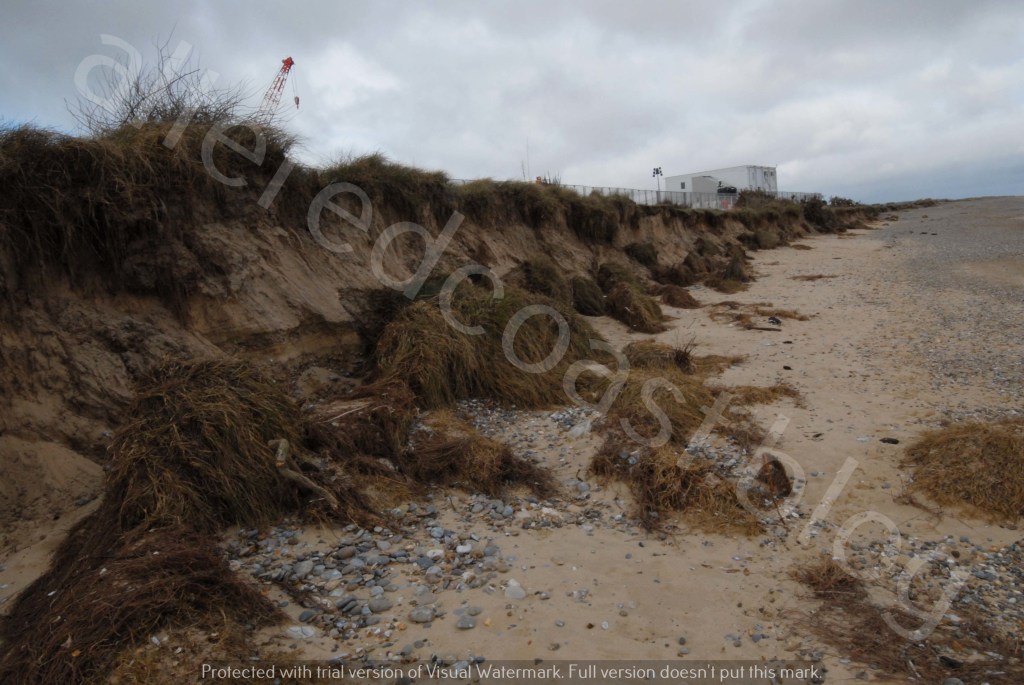
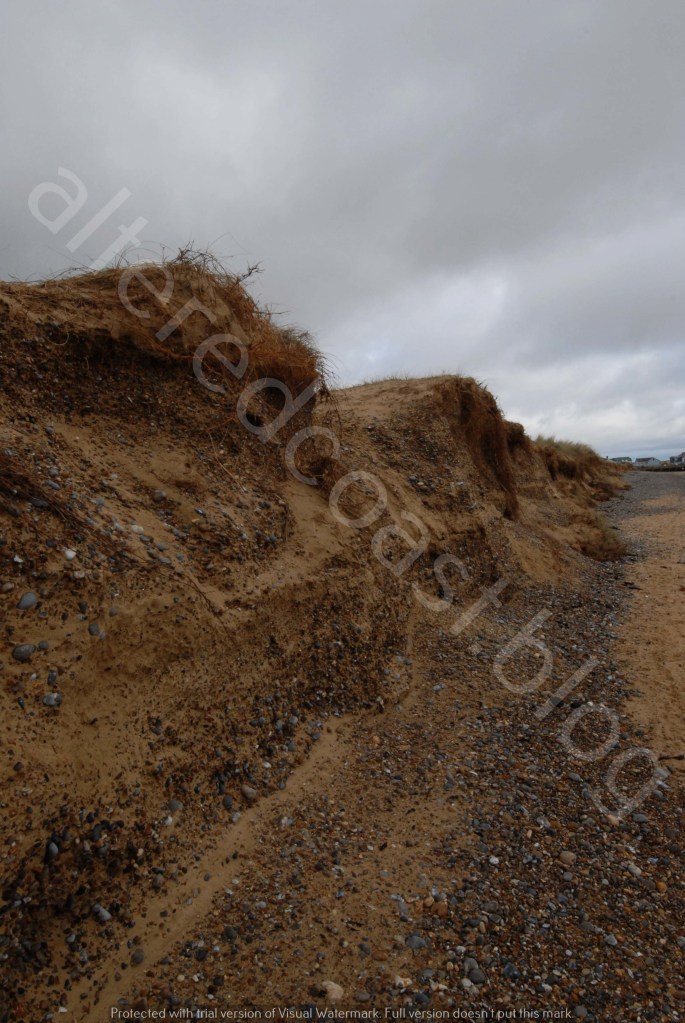
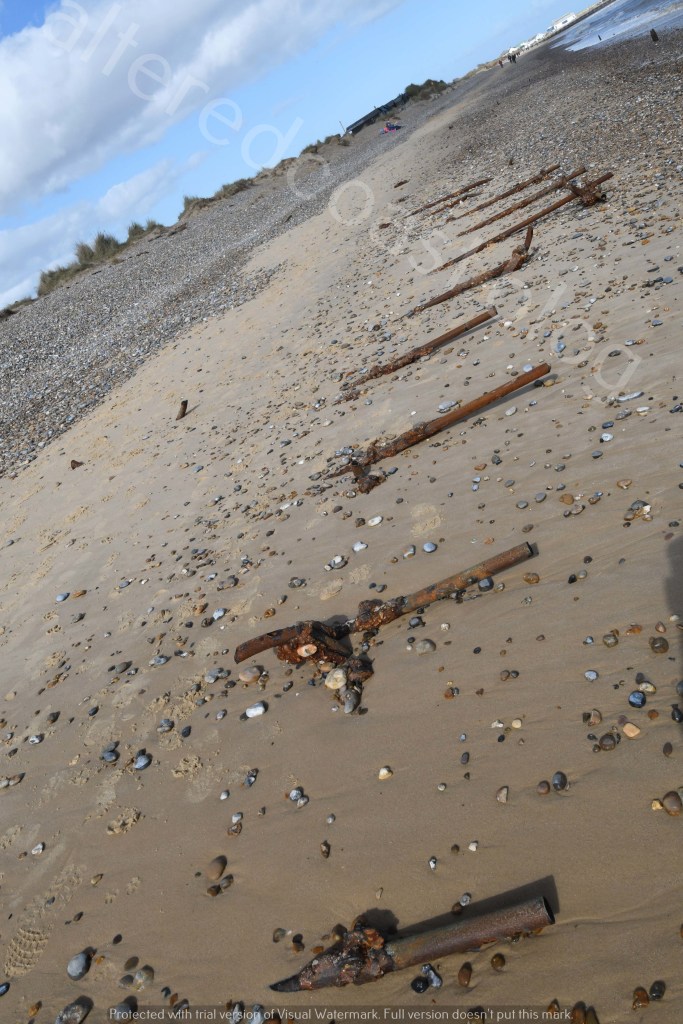
Old wooden posts looking towards eroded dunes. Walberswick. 28th February2026

January High Water 2015 – 2026
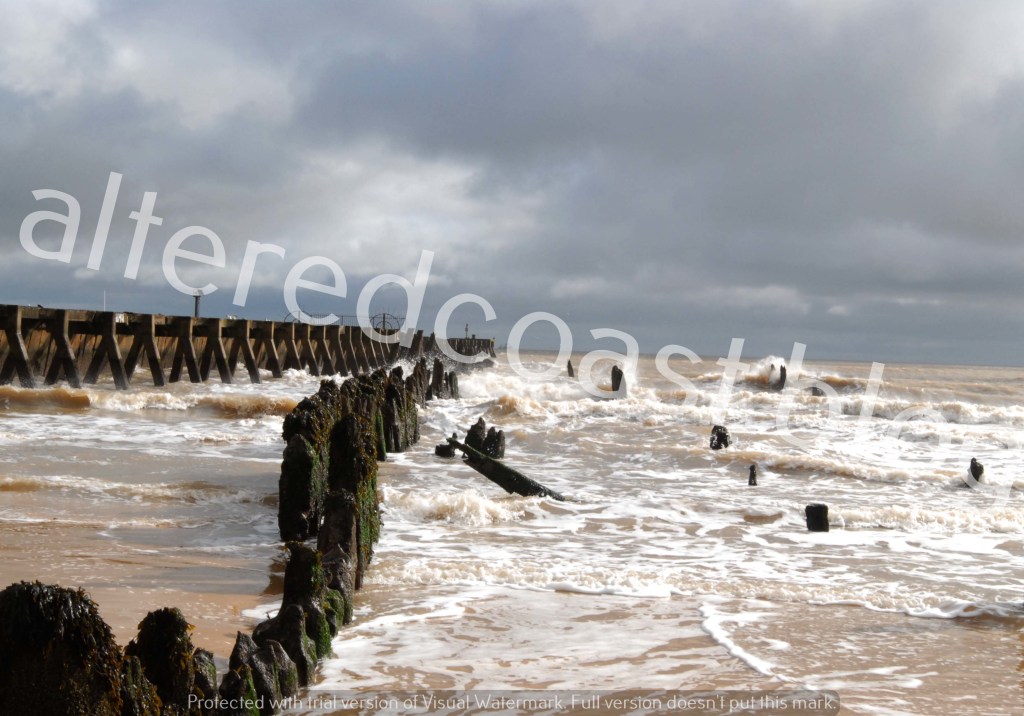
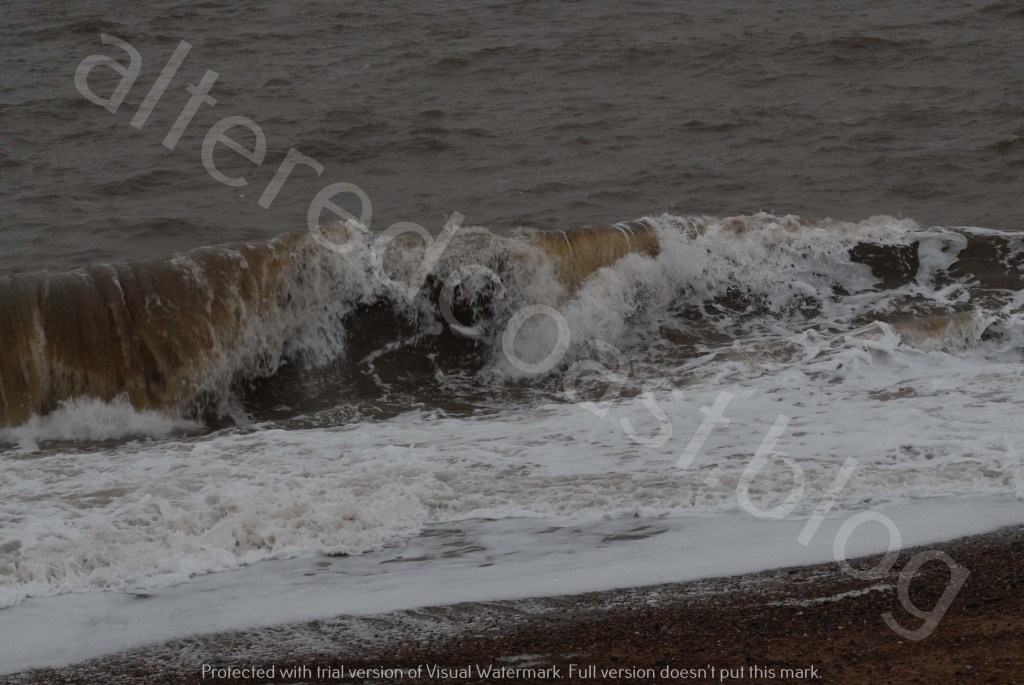
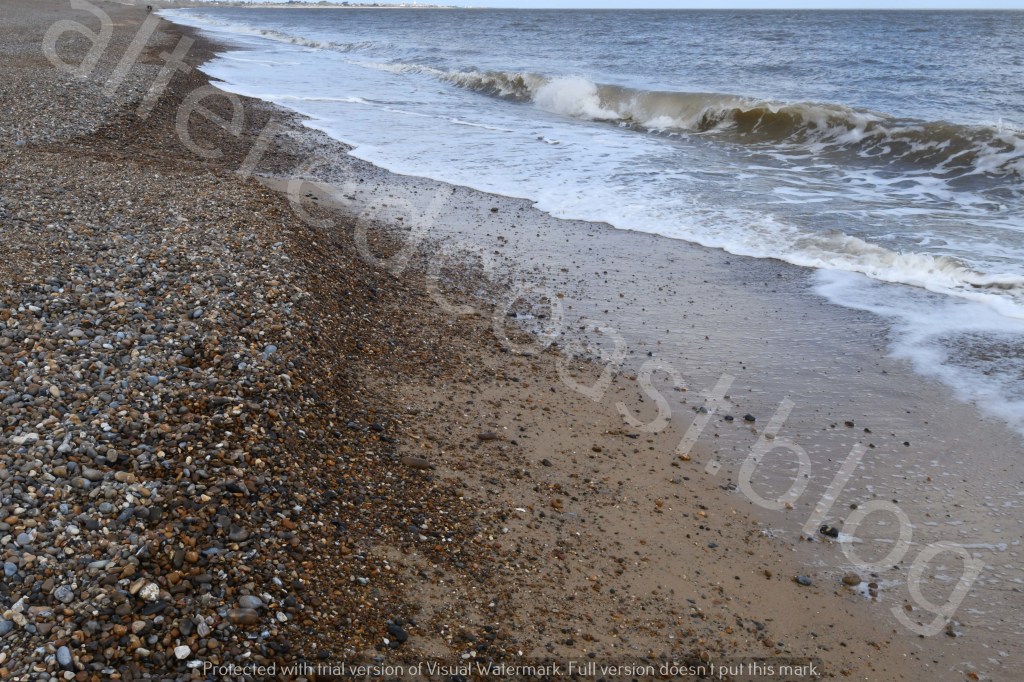
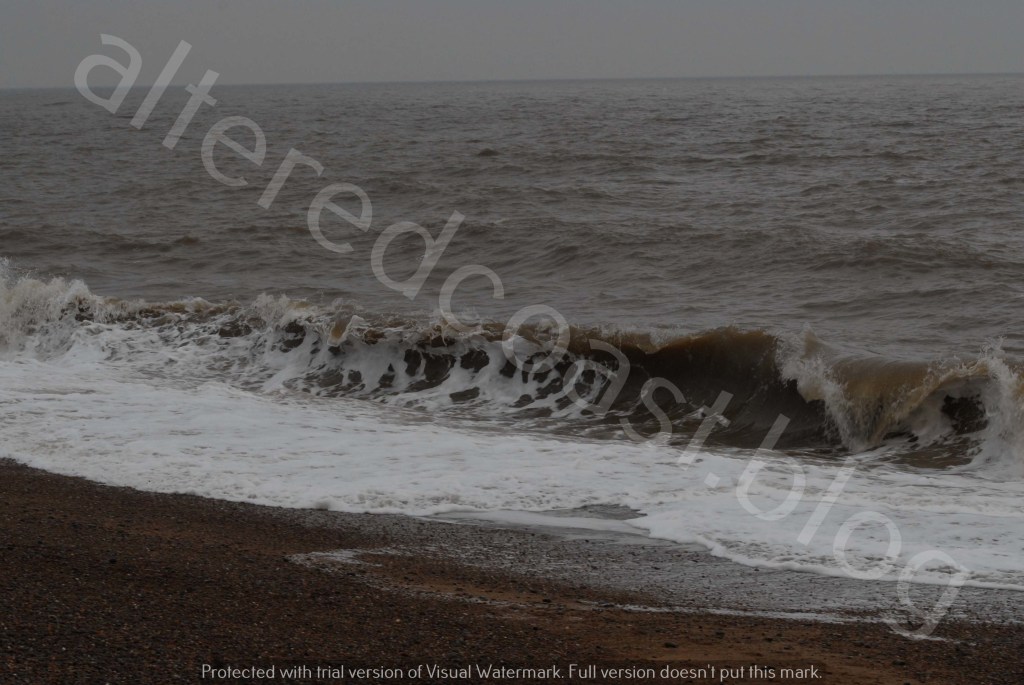
Complex wave patterns on shoreline at Walberswick, Suffolk, East Anglia. 28th February 2026

This discussion will look at observed maximum high-water levels recorded at Lowestoft Tide Gauge for the dates of 1st, 15th and 30th January for 2015 – 2026. Examination of high-water levels for the month of January, with the year 2015, randomly chosen as a base point, began when a very large storm surge occurred on 30th January 2022. The surge event remains an extreme outlier for high-water levels recorded during the period studied. Ongoing observations of tide and high-water levels seek to consider long term patterns and contributory factors to sea state variations.

This discussion also coincides with the release of the Met Office State of The Climate report, which gives assessments for Sea Level Rise (SLR). It is thought SLR has risen by around 20.1 cm since 1901. With a rise of about 13.9 cm believed to have occurred in the years 1993 – 2025, though there is uncertainty about the figures for the UK. However, it is not the intention of this discussion to link annual examination of January tidal data with SLR. It is simply the intention to recognise that observations of high-water levels are occurring alongside assessments of SLR, in addition to narratives regarding possible increases in storm intensity. Indeed, the high figure for observed high water on 1st January 2026, seems to continue a pattern of observations of 3 m + high-water values that appear to be grouped within the last four years since 2022. With one 3 m + high-water value recorded in 2016. These high-water examples are mainly related to meteorological conditions that generated storm surges. Though it is also argued SLR could act to amplify the height of the sea, already raised by a storm.

The chart below shows values for observed maximum high-water levels at Lowestoft Tide Gauge on the 1st, 15th and 30th January of 2015 – 2026.
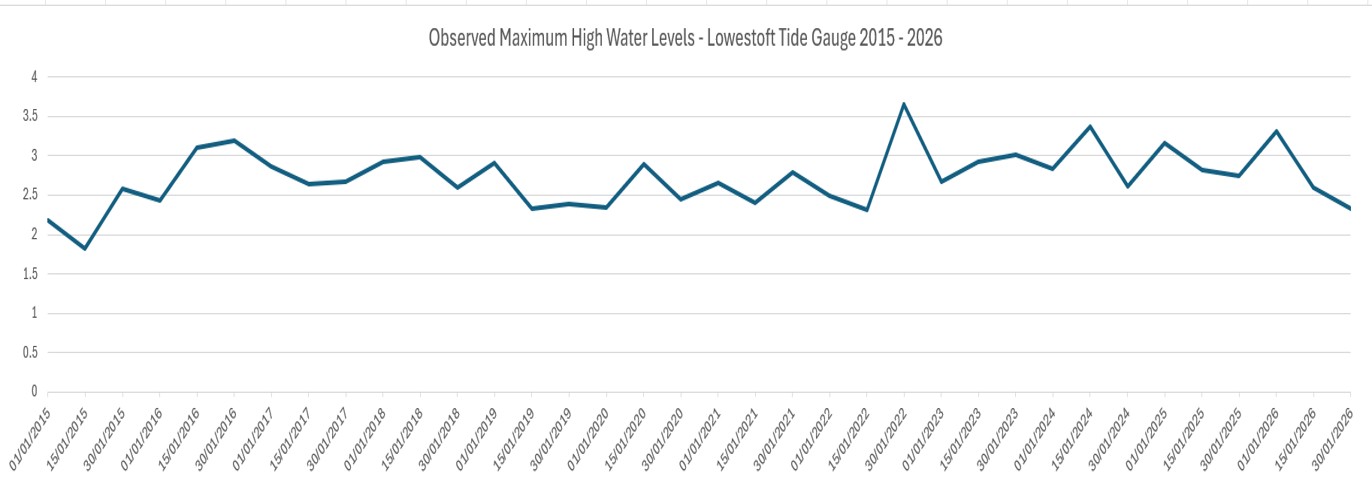
The chart is compiled using data from the National Tidal and Sea Level Facility, provided by the British Oceanographic Data Centre and funded by the Environment Agency. Data is recorded by the Lowestoft Tidal Gauge, Latitude of measuring point 52° 28′ 22.8″ N, Longitude of measuring point 01° 45′ 03.0″ E.

Residual figures on the table for observed high water levels for 1st, 15th and 30th January for 2026, indicate the difference between predicted tide heights and observed high water levels.
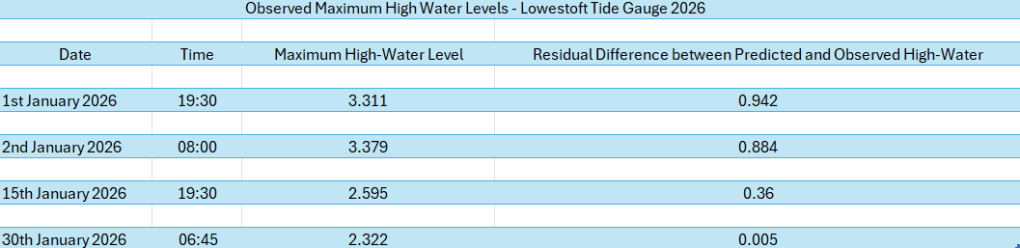
This Table is compiled using data from the National Tidal and Sea Level Facility, provided by the British Oceanographic Data Centre and funded by the Environment Agency. Data is recorded by the Lowestoft Tidal Gauge, Latitude of measuring point 52° 28′ 22.8″ N, Longitude of measuring point 01° 45′ 03.0″ E.

As the values for observed high water levels are simply a snapshot, it is useful to compare the figures with predicted tide hights for the dates of 1st, 15th and 30th January 2026. Data is kindly provided by the National Oceanography Centre, Commercial Software and Data (CSD).
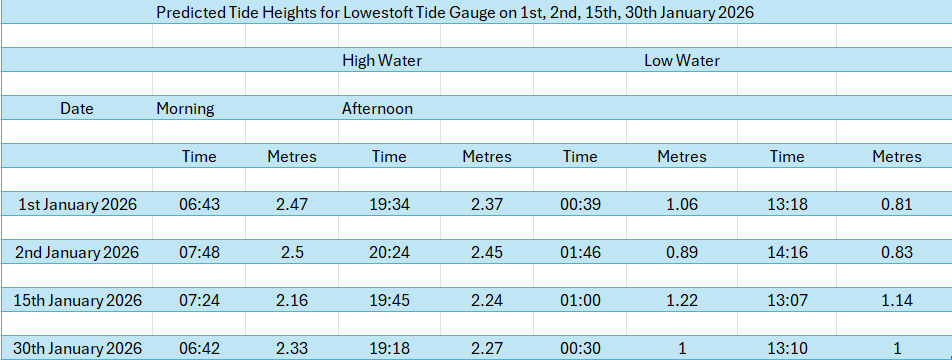
Comparison of observed high water levels and predicted tide heights can be useful for enabling an evaluation of different values from the same tidal gauge for the dates studied. The sea is a fluid body, and it is not surprising that there might be variations between forecast heights and actual sea behaviour. For example, on 1st January, predicted tide height for 19:34 pm was 2.37 m, but the observed high-water level at 19:30 was 3.311 m. The residual difference between predicted and observed was 0.942.

On 15th January, second predicted high tide was at 19:45 with a level of 2.24 m and the value for observed high water was 2.595 m at 19:30 pm. The residual difference between predicted and observed was 0.36 m. For 30th January, first predicted high tide was at 06:42 with a level of 2.33 m and observed high water was at 06:45 am with a level of 2.32 m. The residual figure recorded by the British Oceanography Data Centre give the residual difference between observed and predicted as 0.005 m.

The high-water value for 1st January was recorded around the time a large storm surge travelled down the North Sea Coast that continued for two tidal cycles on 1st and 2nd January 2026. This discussion will briefly look at observed high water levels and predicted tide heights for 2nd January 2026. At 08:00 on 2nd January, the value for observed high water was 3.379 m and predicted high tide due at 07:48 was 2.5 m. The residual figure for the difference between observed and predicted was 0.884. The first predicted low tide on 2nd January was due at 01:46 am with a height of 0.89 m. Observed high water at 3:15 am was 2.556 m with a residual difference between predicted and observed of 1.326 m. Although not covered in this discussion, these figures also offer an opportunity to consider tide-surge interactions. It could also be possible to consider the nature of the forceful conditions or energy that could raise sea heights to such elevated levels at low tide.
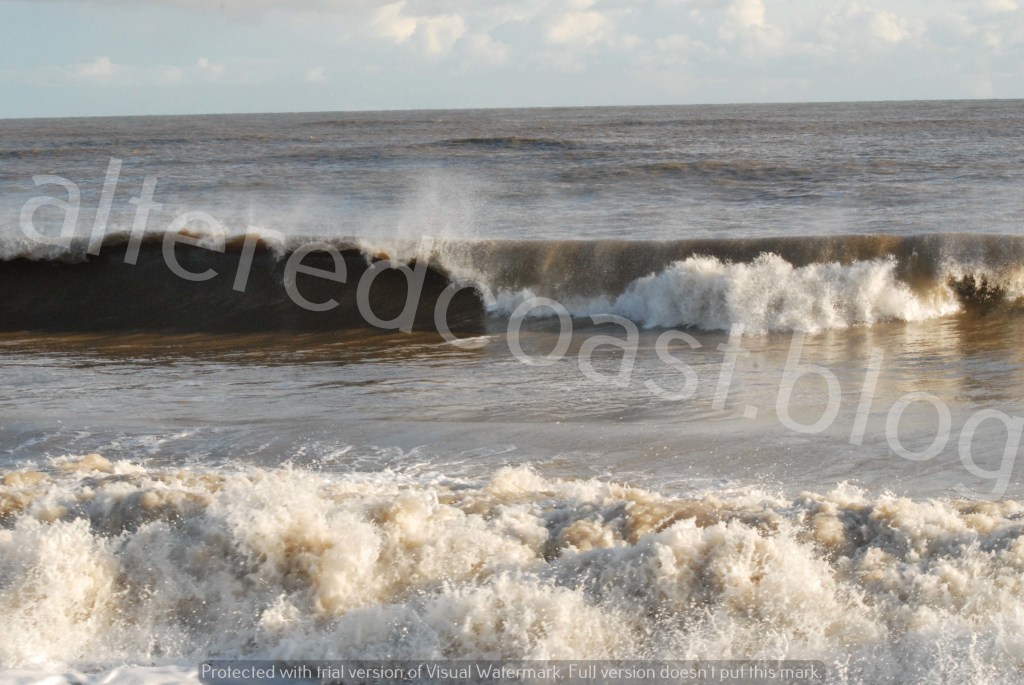
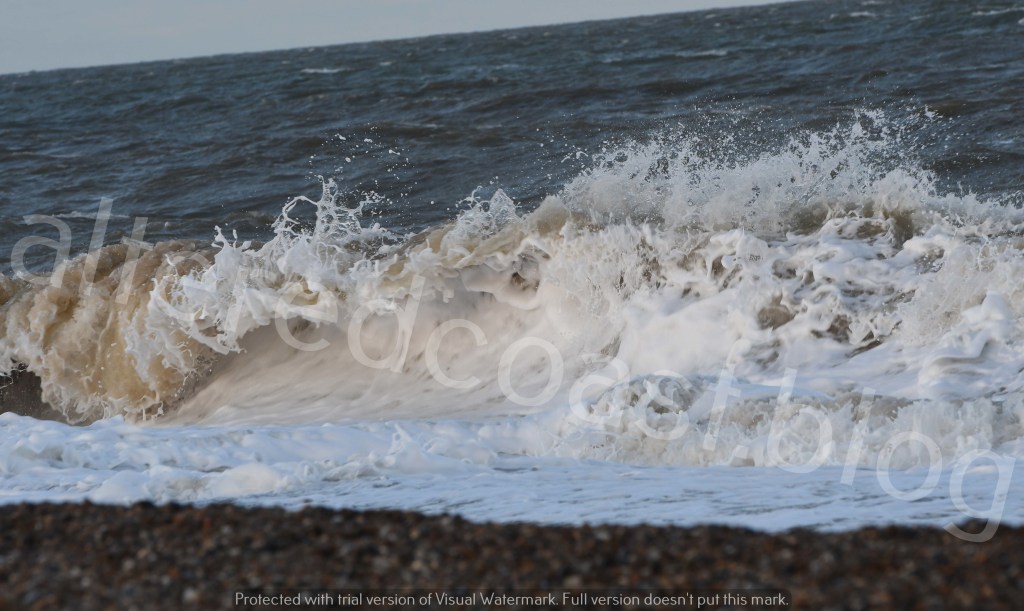
Example of a plunging wave, on Thorpeness Beach. 23rd November 2026

This discussion will very briefly consider conditions that could have generated a surge. On 30th December 2025, the Met Office Deep Dive, (a weekly YouTube presentation from meteorologists giving useful insights weather patterns) forecast strong arctic northerly winds for New Year. The shipping forecast for 31st December – 1st January predicted Westerly Gale force 8/severe gale force 9 winds, veering North Westerly. Met Office Surface Pressure charts showed a low-pressure system of 981 mb to the north of the UK. With tight Isobars signifying very strong winds for North Sea coasts.
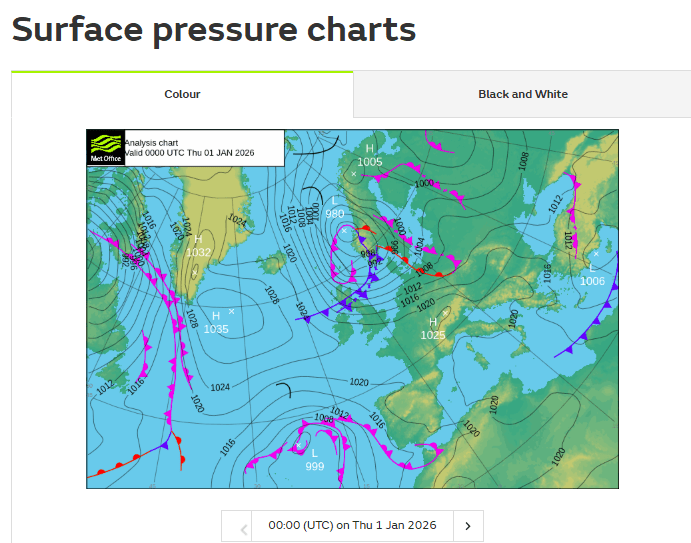
The Met Office Surface Pressure Charts are produced by Surface Pressure Charts – Met Office

The wave and weather gauge at Happisburgh, is part of the National Network of Regional Coastal Monitoring Programmes. The gauge records data concerning sea state behaviour, 24 hours a day, at 10-minute intervals. From midnight on 1st January to around 8 pm on 2nd January 2026, wind gust speeds of 20 knots increasing at times to 28-32 knots were recorded with wind gust speed of 10-16 m-s at times. Wind speed values for gust speeds in knots and metres per second (m-s) can be converted to Beaufort Scale measurements.

The Shipping Forecast and Surface Pressure Charts give an indication of weather conditions, with Northerly/North-West winds capable of transmitting forceful wind speeds into sea water. But at the point a surge hits the coast, it isn’t necessarily the case weather conditions will be stormy. Active conditions that generate surges, can transfer powerful processes through sea water onto beaches to initiate sediment movement and erosion.

This discussion has considered high water levels for three dates in January 1st, 15th and 30th for 2015 – 2026 and the values have been compared to predicted tide heights, including those for 2nd January. The context for fluctuations in sea elevations has been considered, including meteorological conditions, the increasing intensity of storms, and assessments of sea level rise. As the twice-daily flow of the sea can be seen as a barometer of cyclical astronomical influences, evolving weather conditions and sea states. When elevations in the sea, can seem to be felt ever closer to infrastructure and communities on the coast. 
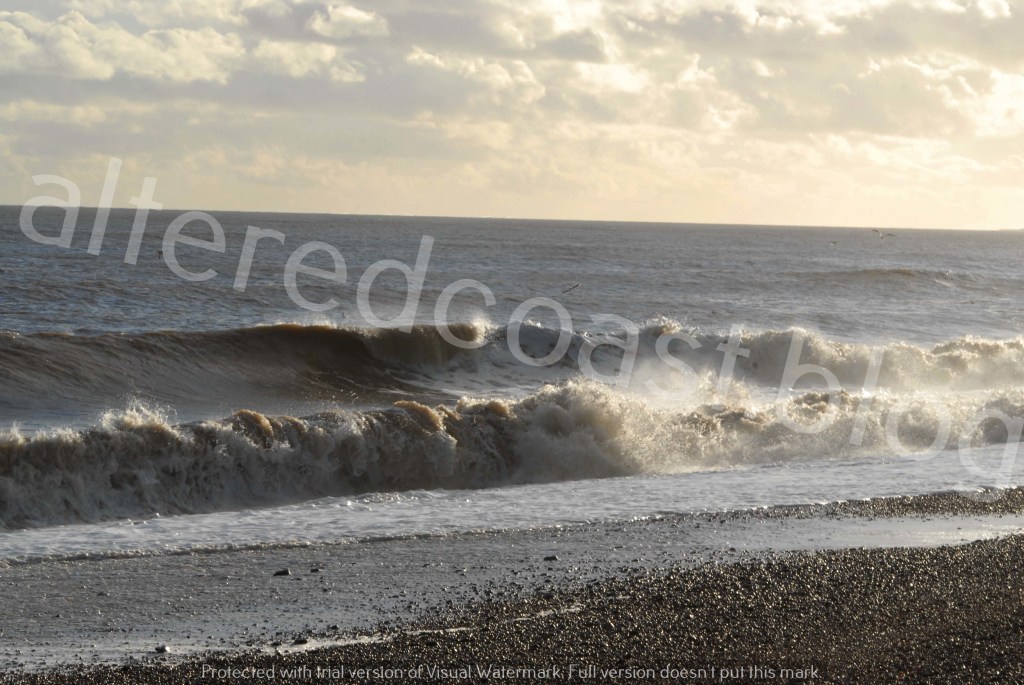
Waves breaking on Thorpeness Beach, Suffolk. 23rd November 2025

Shaken and Stirred

Waves breaking on the beach at Slaughden, Aldeburgh in Suffolk. 25th January 2026

Winter Erosion on the East Anglian coast for 2025 into 2026 has been active with several instances of severe erosion. Hemsby suffered a devasting large-scale demolition of properties, with further demolitions to come. Thorpeness, and Happisburgh also experienced tragic loss of homes, with threats of further property loss. Showing the border between land and sea to be a dynamic, and at times destructive interface. Causing damage as well as revealing links to the past. Like sea glass and shards of pottery dating back to 1920’s in a void formed underneath Hunstanton promenade.  

A large storm surge on 1st and 2nd January caused around 10 metres of dune loss at Hemsby. With severe loss of beach material and cliff retreat occurring at Thorpeness. Additionally, damage to structures saw the formation of a large void in the promenade at Sheringham. The concrete access ramp at Happisburgh was damaged and taken out of action and significant beach lowering exposed the Time and Tide bell.

Spray from waves was observed on a few occasions to pool in the car park behind the flood defence at Southwold. With large puddles of rainwater also seen to accumulate adjacent to the sea water spray. Sea water also accumulated on top of the dunes at Sizewell following the surge on 1st and 2nd January 2026. Substantial dune retreat has occurred at Sizewell, with the formation of Scarps and blocks of dune and vegetation pulled from the dunes.

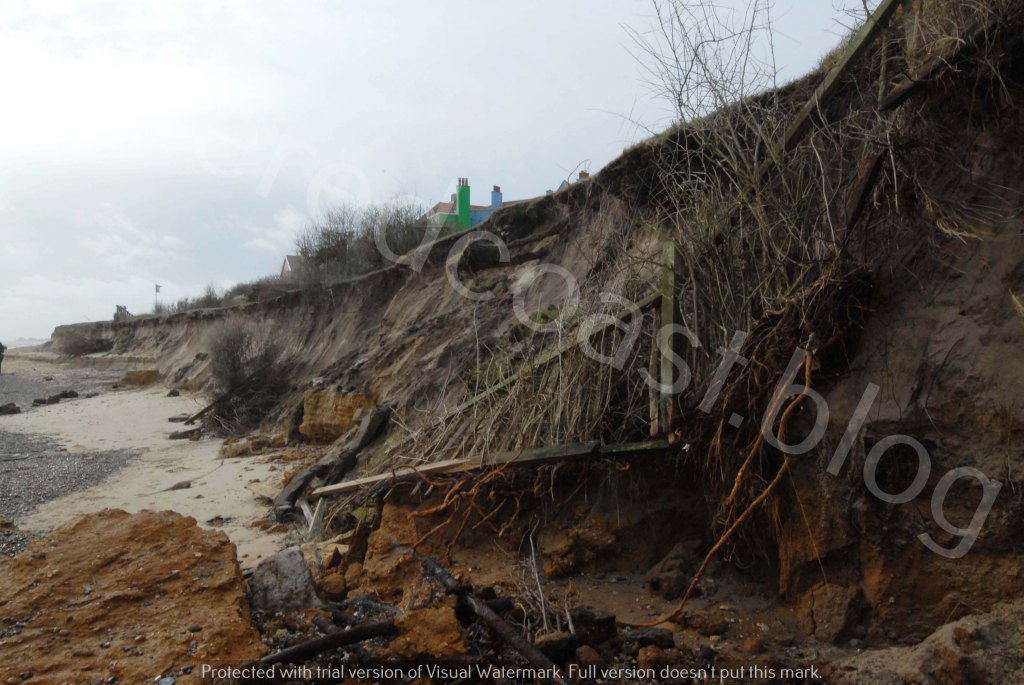
Dune erosion showing signs of Scarps and vegetation pulled from frontage due to wave action. Sizewell Beach. 28th February 2026

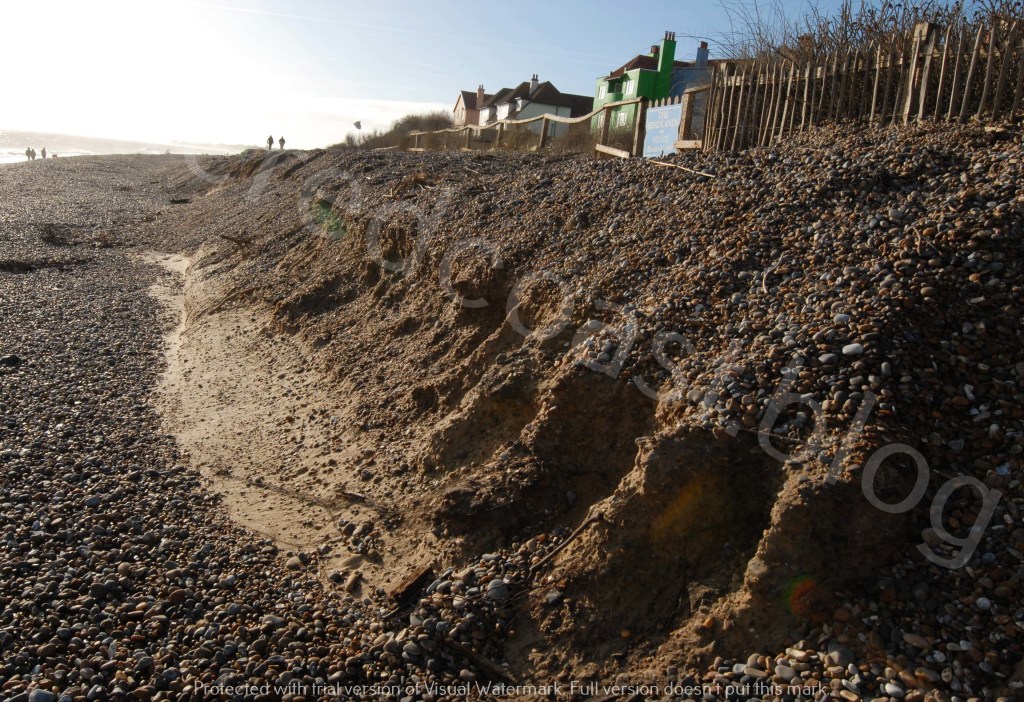
Damage to the dunes has occurred near the construction site for Sizewell C. Creation of Scarps causing dune erosion has also occurred at Walberswick.

Creation of Scarps leading to dune retreat at Walberswick, Suffolk. 28th January 2026.

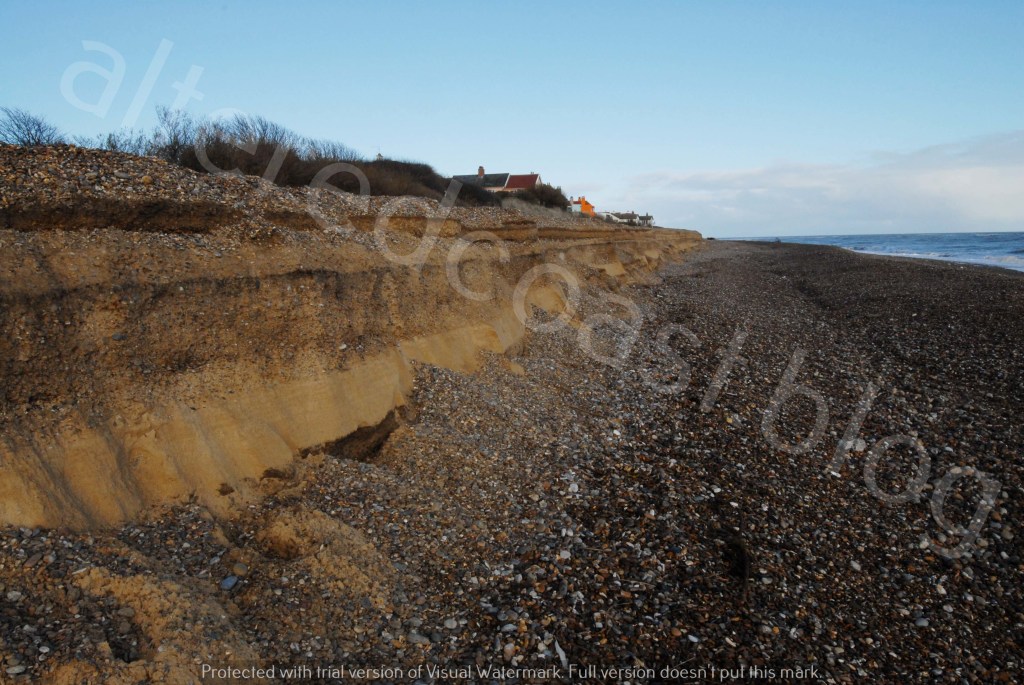
Substantial cliff retreat brought the cliff edge to within 40 metres of Bawdsey Radar Museum, with coastal erosion occurring around East Lane and the coast along to Bawdsey Manor. Bawdsey Haven Yacht Club, at the mouth of the River Deben in Suffolk Cliff also experienced erosion concerns. Cliff falls also occurred at Walton-On-The-Naze and Covehithe. However, locations such as Pakefield got through winter relatively lightly with just a few instances of cliff slumps and wave scour. It is thought this could be due to the ness at Kessingland migrating slowly north.

This discussion will look at the everchanging active interaction between sea, sediment and hard structures. As locations that seem stable, can still show low levels of scouring into shingle.

Waves breaking on Dunwich Beach, Suffolk. Scouring small crescent shapes in the shingle at the shoreline. 2nd April 2026

Or hint at recent high tide lines above high banks of shingle.

Debris from a recent tide line, on top of a high shingle ridge. Dunwich/Walberswick Beach. 2nd April 2026.

Or stripping of beach levels to reveal world war defences.

Exposure of world war defences on Walsberswick Beach, Suffolk. 2nd April 2026.

But how does the regular re-working of a beach shift to powerful conditions that can lead to severe erosion or a sudden forceful break. Is it simply that strength in a wave due to a storm, applies a greater level of pressure which can initiate substantial increases sediment movement. Or alter or impact a hard structure.

To consider these points, this discussion will look processes that occur in what is known as the Swash Zone, the area where waves wash up and down the beach. In this location, subject to profile influences, energy can be is dissipated when a wave breaks. It could be possible to consider how this energy, or Aggregate Surplus Strength is expended in normal conditions, and how it is released should wave conditions be stronger. Perhaps because of distant or nearby meteorological conditions.

In relation to dunes, it is thought that as forceful waves clash with a frontage, they can create friction as they retreat. Sea water stresses can excavate lumps of dune and vegetation. Structure can be sustained in the early stages by vegetation, but sustained wave action can displace it with action to drag out roots releasing sediment. Cliff erosion can be caused by wave action or rainwater seeping into its structure.

In the case of a sea wall, the Aggregate Surplus Strength of a wave can be constrained within its impact against a hard structure. In addition, factors such as faster wind speeds might generate higher wave conditions and enhance faster suspension of sediment in front of sea walls. Hard defences are built to prevent flooding of land behind them, but they cannot shift like fluid dynamic beaches.

The Aggregate Surplus Strength of waves can vary with actions of turbulent sea water to strip sediment and lower beaches, often transitory, as systems follow tidal cycles and sea states. In brief episodes or over longer time scale, processes such as Liquefaction can occur. Tensions between individual sediment grains can break down, due to increases in pore water pressure between the grains. This can create a complete flowing mass of sediment and water. Such a unitary flow, once set in motion, is likely to the transport sand away from the beach. A possible consequence, in relation to sea walls can be Toe Scour. A trench can form along the base of a structure, which could lead to undercutting, if beach levels reduce below the base of a hard defence.

In relation to the void under the promenade at Sheringham, an engineer working at the site, believes formation of the void could relate to how the hard structure was cast on chalk bedrock over 70 years ago. Sea water could have dissolved the chalk, causing sand and gravel to be released from behind the sea wall.

As winter erosion has shaken the East Anglian coast, with instances of people and structures, shaken out of their foundations. It could be worth considering the messages of the winter profile marks on the coast. To ask if winter erosion represents a profile readjustment and consider what might be stirring the big brown waves of the North Sea. To consider the implications for beaches, hard structures and people on fragile coastlines.

Waves breaking on Slaughden Beach, Aldeburgh, Suffolk. 25th January 2026

Boundary Between Sea and Land

Coastal storms: Processes and Impacts. Editor Paolo Ciavola, Giovanni Coco

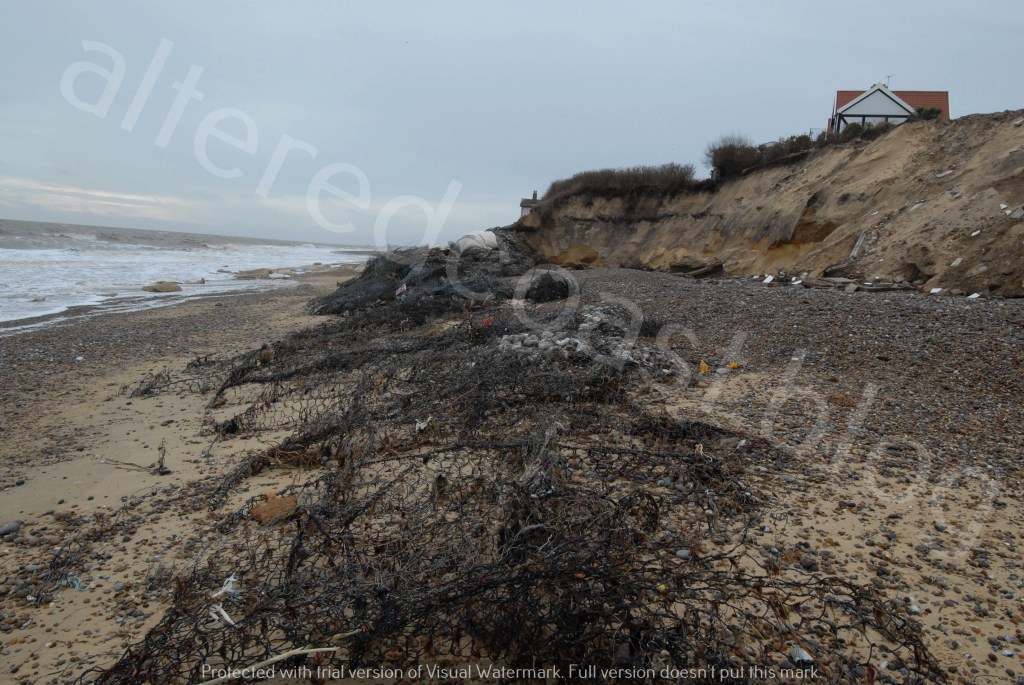
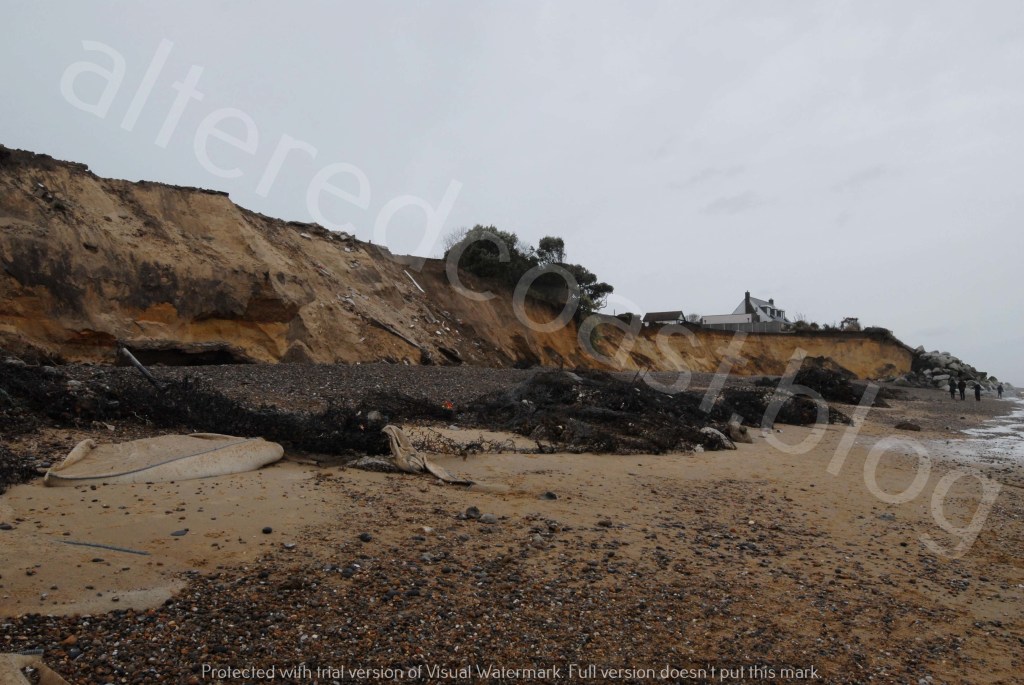
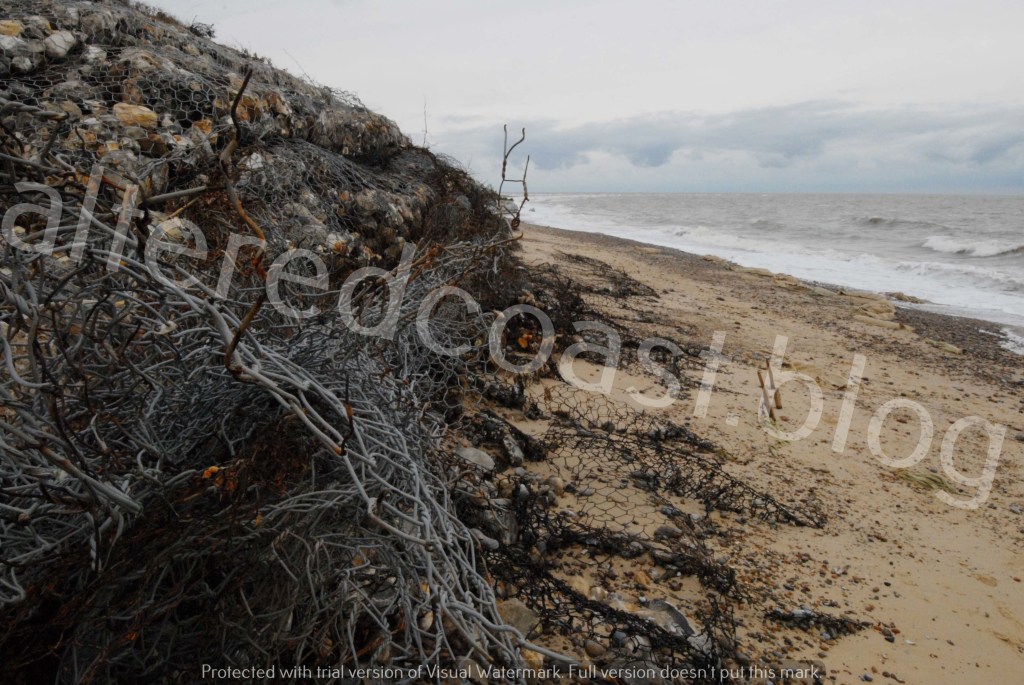
View of site of severe cliff retreat and remains of Stone Gabion basket sea defences. Thorpeness Beach. Photo taken 11th January 2026.

Winter erosion, as with many places on the UK coastlines, has been severe on the East Anglian coast. Locations like Hemsby saw 10 metres of dune loss in one night due to a storm surge on 2nd January. At Thorpeness, it is thought around 27 metres of cliff have been lost in a little over two years. Therefore, this first look at Winter Erosion, will firstly consider Thorpeness, with thoughts suggesting wider considerations about severe erosion on the East Anglian coast.

At Thorpeness around 5 homes have tragically been lost since October 2025, with the continuing erosion so severe and large-scale it defies comprehension. The loss of memories and beach, so sudden and dramatic, words don’t seem enough to describe what has occurred. Nevertheless, this discussion will consider contributory factors to the erosion, with a view to asking whether for Thorpeness and the wider coastline it:

‘marks severe discontinuities; what comes after will not be like what came before’

– Donna Haraway – quoted in PhD on Coastal Erosion Poetry Hold The Line by Alison Stoneman.

The main features Erosion at Thorpeness include a large quarry shaped cliff retreat, creation of Scarps, and complete removal and stripping away of beach material. Processes contributing to the formation of each feature will briefly be discussed.

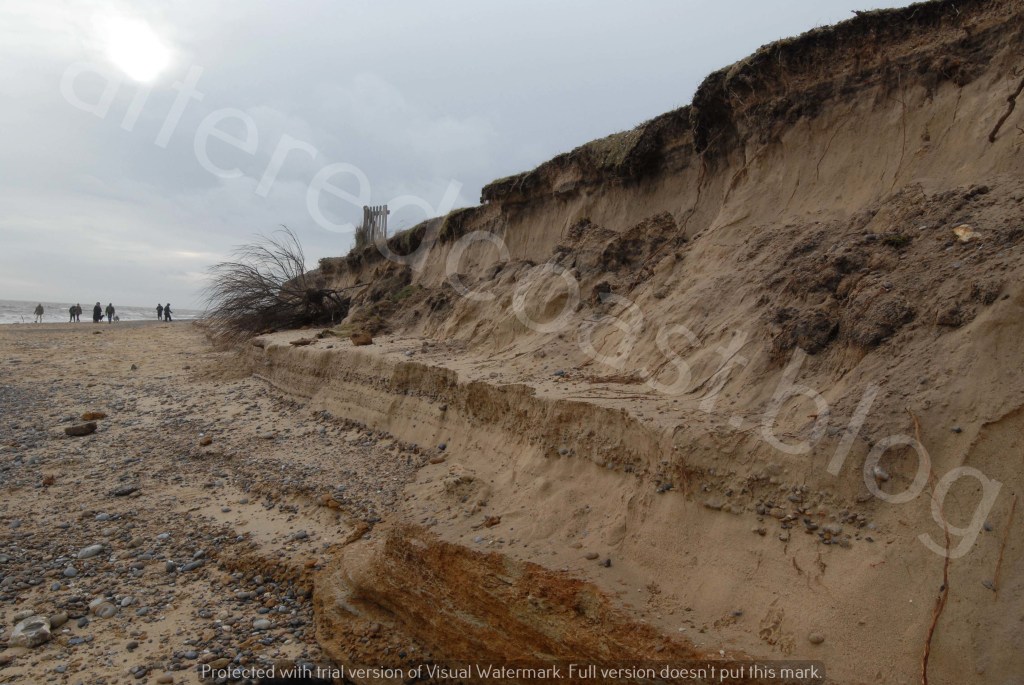
Eroded cliff face at Thorpeness Beach with remains of Stone Gabion Baskets. Photo taken 11th January 2026.

Firstly, it would seem necessary to consider the Aggregated Surplus Strength of sea states energised by wind and weather. The weight and power of such waves can propel a strong column of Water directly against a cliff surface. Residents at Thorpeness talk of hearing vibrations deep inside the cliff structure when powerful waves hit the cliff frontage. Such powerful action can scour and over-steepen cliff surfaces, creating instability, causing sediment to collapse. Additionally, another version of this process is the creation of steep cliff features on the cliff frontage. With the amount of sediment moved related to the magnitude of the clash of Swash waves against the cliff.

This moves the discussion down the beach slightly to a location known as Tinkers End. But as the discussion moves to a new area, it takes something with it in the form of sand. With a tentative suggestion that severe erosion of cliffs predominantly formed of sand, could have released sand into the beach system. This could have affected the structure of the shingle. Potentially creating a damaging feedback loop.

As, it is thought shingle beaches can be permeable, as sea water in the Swash as it runs up the beach can infiltrate into shingle. But if sand filters into the space between the shingle this could limit the permeable characteristics of a shingle beach. This could relate to the formation of Scarps, features that were visible at Tinkers End on 30th December 2025.

A Scarp erosion feature on Thorpeness Beach. Photo taken 30th December 2025

A Scarp can form when energetic Swash waves erode into a shingle ridge on a beach. Subsequent saturation of sand within the shingle, can causes a collapse of sediment, which along with erosion of beach surface, can steepen the emerging Scarp. As swash waves continue to cut into the Scarp, it becomes steeper and can move landward as more sediment is eroded from the base of the Scarp.

Two days after the Scarp was observed at Tinkers End, a very powerful storm surge, that lasted for two tidal cycles on 1st and 2nd January 2026, swept down the East Anglian Coast. The following images shows the two beach states before and after the storm surge. The first image was taken on 30th December 2025:

Image showing erosion into Shingle ridge at beach near Tinkers End, Thorpeness Beach. Photo taken on 30th December 2025.

The second image was taken on 11th January 2026.

The surge severely escalated the erosion at Thorpeness, particularly at the area where the Scarps had formed, with the steep cliff features pushed much further landward. Additionally, large volumes of beach material were completely stripped from the beach. Exposing the Red Crag or Coraline Crag which is thought to underlie the beach surface around Thorpeness and Aldeburgh.

Image showing exposure of Red or Coraline Crag following Storm Surge. Photo taken on 11th January 2026.

Forceful waves and surges can exploit existing weaknesses on beaches or create new fragilities. With beach surfaces and current and new infrastructure built close to the edge of the beach, possibly becoming increasingly vulnerable to forceful wave action. As sea states look likely to increase in intensity due to climate change. As coastlines and people experience acute departures from lives once thought to be solid. As futures are increasingly caught in the turbulent boundary between sea and land.

A Scarp feature on Thorpeness Beach following Storm Surge. Photo taken 11th January 2026.

Erosion and Demolition at Thorpeness

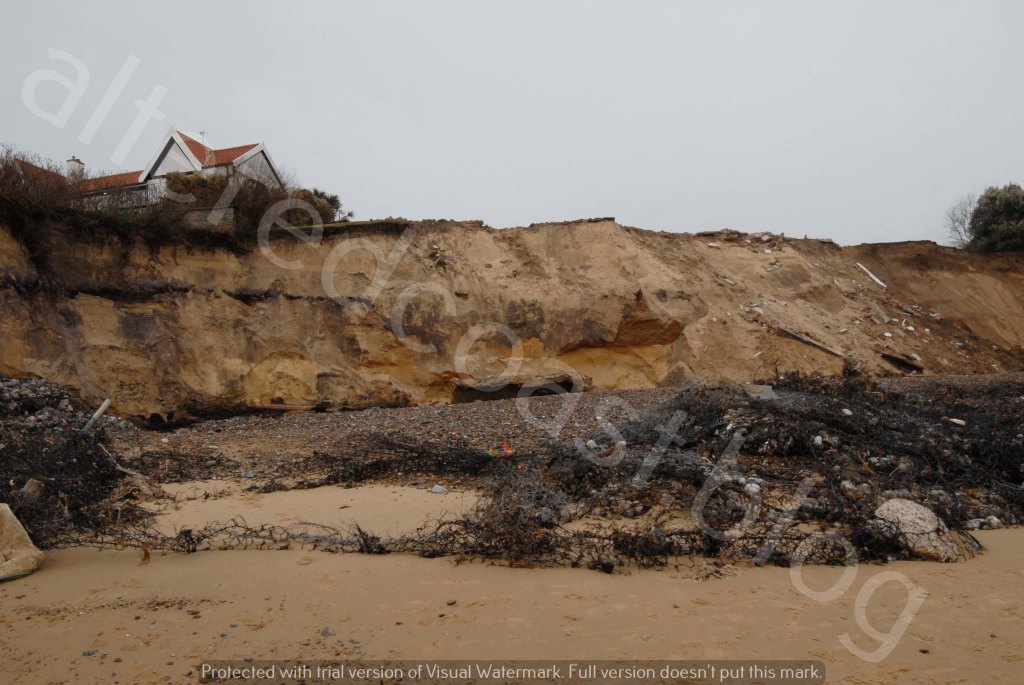
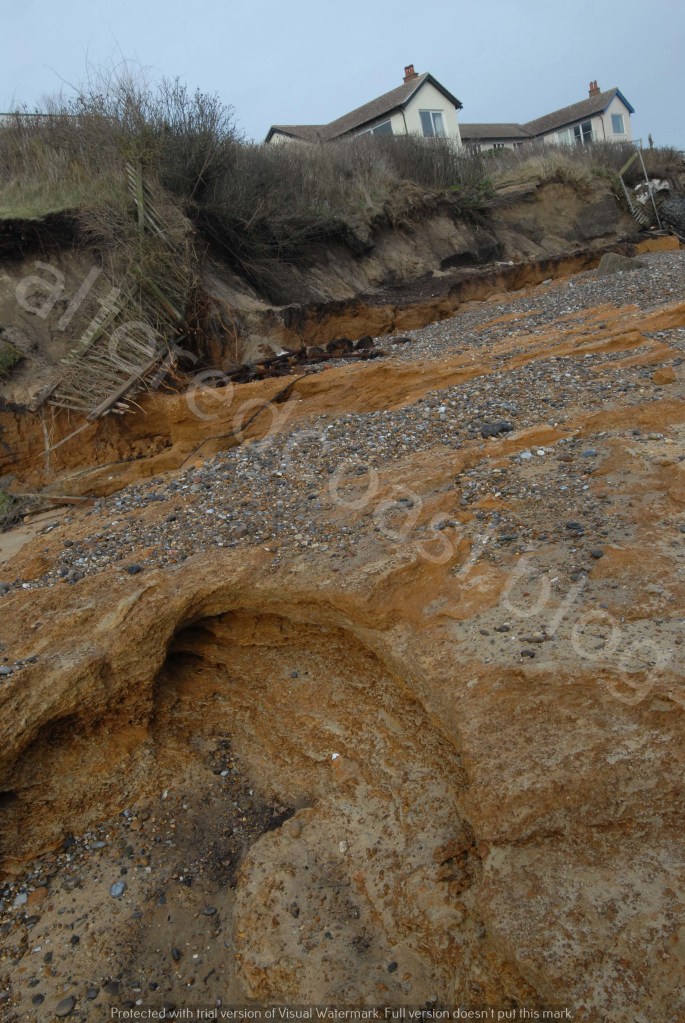
An area of beach that has seen severe erosion with many tens of metres of cliff retreat, leading to the demolition of two properties. 11th January 2026.

Severe erosion sadly continues to see demolition of properties on North End Avenue at Thorpeness. It is thought over 6-8 metres of cliff has been lost in recent months.

This cliff retreat is in addition to loss measured by coastal managers, for the location south of the rock revetment at Thorpeness Beach, the site of the most recent demolitions. For monitoring purposes, the area is categorised as Transect SO38, and retreat of around 20 metres is assessed to have occurred since the first survey in 1991.

As a physical contribution to attempts to understand the erosion, a photo taken in late December 2024, could hint at early processes at work immediately south of the rock revetment on Thorpeness beach. It appears wave action was reaching beyond the Gabion stone baskets and starting to erode into the face of the sandy cliffs.

Erosion into the cliff face behind broken Stone Basket Gabions, south of the rock revetment below North End Avenue, Thorpeness. Suffolk, East Anglia, UK. 30th December 2024.

This location, and Thorpeness Beach more generally, can be a very high-energy environment. Conditions made all the more dynamic by the increasingly intense storms that hit the UK. Severe erosion at Transect SO38 is thought to have occurred between December 2024 and April 2025. But winter storms to date in 2025 could have worsened the erosion.

Waves breaking in front of broken Stone Basket Gabions at the entrance to the site of severe cliff retreat that has led to recent demolitions. 23rd November 2025.

Storm Claudia hit the UK on Friday the 14th of November 2025. The Shipping Forecast predicted Gale Force 8 wind gusts and the wave buoy at Lowestoft recorded a Significant Wave Height of 3.5 metres. The storm alert threshold is 3.06, waves at or above this height are thought to have the potential to move significant amounts of beach material. On 16th November 2025, a Flood alert was issued for the Suffolk coast from Lowestoft to Bawdsey. A very powerful storm surge of around 1 metre was forecast to raise the tide at Lowestoft to almost 3.5 metres.

On 1st December 2025, severe gale force 9 and Storm Force 10 wind gusts were forecast for Aldeburgh, with a wind direction of SSW. A SWH of just over 3 metres was recorded at Lowestoft. On 5th December 2025 the Met Office forecast strong winds speeds of Gale Force 8 – Severe Gale Force 9 and Storm Force 10 winds for Aldeburgh from a SSW/S/SSE direction. On 6th December a SWH of 3 metres was recorded at Lowestoft.

Thinking about the area below the location of the recent demolitions, south of the rock revetment. It is possible to wonder at the energy levels in the wave action that contributed to the severe erosion. Particularly as it is thought on mixed sand and shingle beaches, the surf zone (where waves break) can be quite narrow. So waves can also break directly in the swash zone, the area of beach where waves rise and fall. Meaning almost all energy is expended when waves break and wash up the beach.

Wave action can be influenced by and fundamentally re-work the structure of the beach. Each crashing of a wave as it rushes up and flows down, echoing earlier actions, constantly repeating and reinforcing new patterns. With forceful actions driving instability deep into the cliff structure. Additionally, the seepage flow of ground water combined with the destructive backwash of a wave can flow out through the shingle, drawing sediment out to sea.

The configuration of a beach can withstand sustained storm damage and can indicate stability for days, weeks or months. But maybe the recent increased force and intensity of storms capable of deepening rapidly, could exert such a strength they could force a break in the bones of the beach. So that ability to recover and repair no longer apply and it could be asked whether it is the design of the beach that still determines wave action. Or whether now it is the waves themselves which master the beach, sediment and cliffs they encounter.

Stone Basket Gabions showing signs of wave damage on section south of scene of recent severe erosion. Thorpeness Beach, Suffolk, East Anglia, UK. 18th October 2025

5-Year Anniversary

Following recent high waves and strong winds on the East Anglian coast, it is perhaps appropriate to announce the 5-year anniversary of the blog Altered Coast and its previous incarnation Altered Marshes.

Hazlewood Marshes, an intertidal nature reserve owned by the Suffolk Wildlife Trust, next to the Alde and Ore Estuary. 20th September 2025

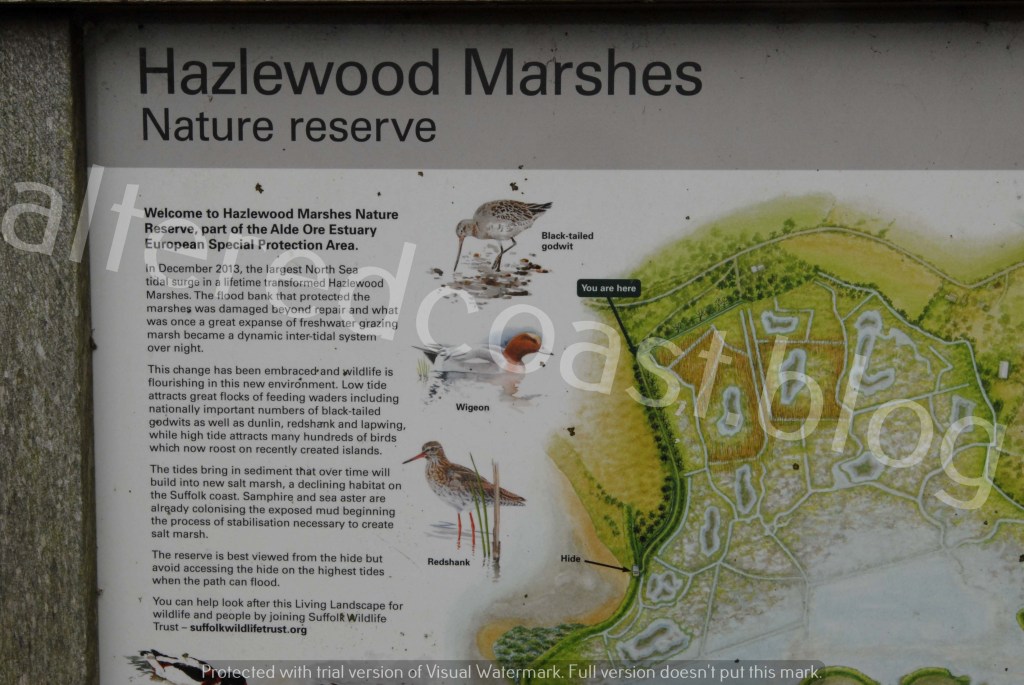
The original inclusion of the word marshes is due to a visit in 2020 to Hazlewood marshes, an intertidal reserve next to the Alde and Ore estuary, run by Suffolk Wildlife Trust. The experience of visiting Hazlewood and the reason for its present incarnation, prompted an interest to find out more and Altered Marshes was set up as means for these discussions.

A information board at Hazlewood Marshes explaining the origins of the reserve explaining how it became intertidal in 2013. 20th September 2025.

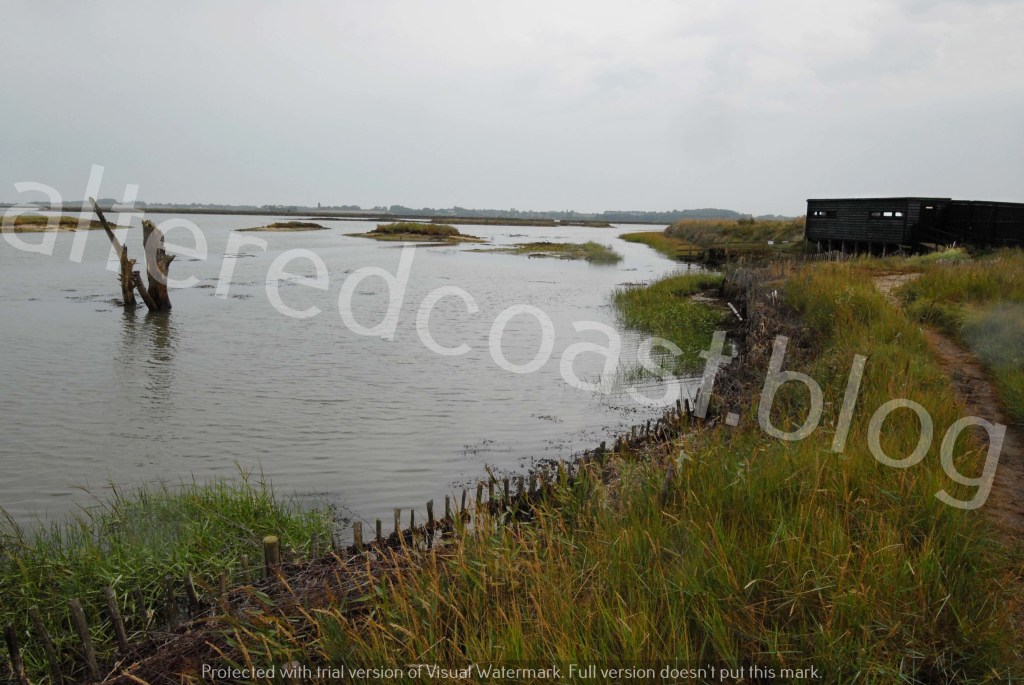
Hazlewood Marshes used to be a Fresh Water marsh, but became intertidal following a storm surge in 2013, which broke through the sea wall between the estuary and the marsh. The reserve is thriving now, but erosion continues, with work constantly needed to protect the path out to the Bird Hide, on the right-hand side of the reserve.

View looking towards the Bird Hide at Hazlewood Marshes, with work by Suffolk Wildlife Trust to install Brash to try and withstand the path erosion just visible above the fence line.

Altered Marshes started, therefore, to look at estuary systems and erosion around the Alde and Ore Estuary in Suffolk. However, the 1st Anniversary post in 2021, concluded by outlining a change in focus to look at the characteristics of tides in the estuary and the open sea. To consider how these elements can shape the areas under observation. Therefore, the progression to the open coast had begun and subsequently, the name changed to Altered Coast.

View looking towards Thorpeness from Aldeburgh Beach, Suffolk, East Anglia. April 2021

The first location observed on the open coast was Thorpeness, one of many dynamic vulnerable locations to be visited, which has subsequently included Pakefield, Covehithe and Hemsby. 

Section of broken road looking towards Hemsby Gap at Hemsby Beach, in Norfolk. 2024

Study of the exposed, fast eroding beach at Hemsby brought a focus on the influence of near-shore processes, and the morphology, (shape) such as sandbanks. As well as a study of the effects of high-energy waves on beach levels, and dune frontages. This is turn, introduced ideas around coastal geomorphology. An academic discipline that considers the profiles of coastal geographies and the systems that influence their form. In addition, the influence of near-shore features on waves and how wind and waves are both influenced by coastal profiles and can also shape and irrevocably change and re-work coastlines.

The intention of discussions going forward is to try and take a step back and as well as examining locations individually, to also look at erosion, sea states, morphology (shape) of coastlines, rainfall and flood defence in a bit more depth. In addition, as Altered Coast continues to observe and analyse coastal change, storms and sea states, the concept of Palimpsest will be considered again. To see features of coastal damage as signposts, information boards, to tell of what has happened, and to enable a learning about what has happened before.

Recent erosion at Thorpeness Beach, seeming to reveal sections of cliff material laid down at the time of the Pleistocene. North End Avenue. Suffolk. 20th September 2025.

To also set discussions in an historical context, by looking at communities previously lost to the sea, such as Dunwich, to try and understand coastal erosion anew. To keep an awareness of the proximity of the East Anglian coast to Doggerland. An area of land between Europe and England, inundated at the end of the last ice age. Forcing communities that dwelled on the land to flee the rising seas. In a poem by Justina Hart called Doggerland Rising, Hart wishes to ask what our Mesolithic ancestors might whisper to us through the centuries if they could, about how we should interpret loss, re-working of coastlines and changing seas.

  • January High Water 2015 – 2026
    This discussion will look at observed maximum high-water levels recorded at Lowestoft Tide Gauge for the dates of 1st, 15th and 30th January for 2015 – 2026. Examination of high-water levels for the month of January, with the year 2015, randomly chosen as a base point, began when a very large storm surge occurred on… Read more: January High Water 2015 – 2026
  • Shaken and Stirred
    Winter Erosion on the East Anglian coast for 2025 into 2026 has been active with several instances of severe erosion. Hemsby suffered a devasting large-scale demolition of properties, with further demolitions to come. Thorpeness, and Happisburgh also experienced tragic loss of homes, with threats of further property loss. Showing the border between land and sea… Read more: Shaken and Stirred
  • Boundary Between Sea and Land
    Coastal storms: Processes and Impacts. Editor Paolo Ciavola, Giovanni Coco Winter erosion, as with many places on the UK coastlines, has been severe on the East Anglian coast. Locations like Hemsby saw 10 metres of dune loss in one night due to a storm surge on 2nd January. At Thorpeness, it is thought around 27 metres… Read more: Boundary Between Sea and Land