
On 29th January 2022 a weather system, named by the Danish Meteorological Institute as Storm Malik, brought significant winds to the UK. The storm passed to the North-East of the UK and generated a large storm surge on 30th January 2022, which travelled down the east coast and had considerable impact at several locations on the East Anglian coast.
The surge occurred on a Neap Tide but it still raised sea levels at Cromer in (Norfolk) to the highest elevation recorded for 2022, with a Skew Surge of 1.4 m recorded. Similarly, at Lowestoft a skew surge of 1.3 m was logged. Furthermore, the storm surge travelled up the River Waveney from Great Yarmouth causing severe damage at Haddiscoe cut railway embankment and Carlton Marshes.
Additionally, at Slaughden, Aldeburgh in Suffolk, the surge arrived at the Alde and Ore Estuary around two hours before the usual High Tide. At Slaughden, there is a fairly narrow strip of shingle and compacted tarmac and track in-between the open coast and the Alde and Ore Estuary. Several boat yards and the Aldeburgh Yacht Club have premises at Slaughden that face out onto the Alde and Ore Estuary.
On 30th January 2022, high water was observed to be almost at the top of the sea wall on the estuary side and the open coast at Slaughden at the same time. Usually, the tide on the open coast would ebb away around 2 hours before High Tide is due on the Alde and Ore Estuary. High water remained at the same level at the top of the sea wall on both river and open coast for around 2 hours, before it ebbed as it would normally on the Alde and Ore estuary. On the open coast, at times the sea was estimated to be near the highest level observed to date on the beach side at Slaughden.
To consider the question of observed high water levels in more detail, it was decided to study data for three specific dates, the 1st, 15th and 30th for the month of January 2015-2022. Data was obtained from the British Oceanography Data Centre, from the Port, P024 at the site of Lowestoft, with the Latitude of 52.47300 and Longitude of 1.75083 with the start date of 01JAN2015-00.00.00 and end date of 23:45:00 for each year analysed. For data analysed in July, the start date was 2015/07/01 00:00:00 and the end time was 23:45:00 for each year analysed. The Contributor was the National Oceanography Centre; Liverpool and the data refers to Admiralty Chart Datum (ACD).
Data showing the maximum observed tide level for the dates of 1st, 15th and 30th for the time period of January 1st 2015 to 30th January 2022 can be seen displayed in the chart below.
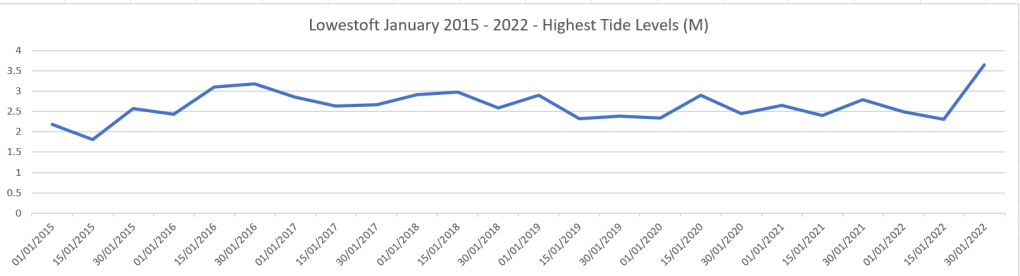
However, to get a better perspective, on the significance of each observed tide height, it is possible to examine whether the tide figures were within predicted heights, or heightened by surges. To do this, the Tidal Residuals, (the measured height minus the predicted height of the tide) can be considered for the tide heights measured in the charts above. Predicted values are derived from a database of tidal constants maintained by the National Oceanography Centre Application Group. All values are relative to Admiralty Chart Datum (ACD). Data is from the British Oceanography Data Centre.
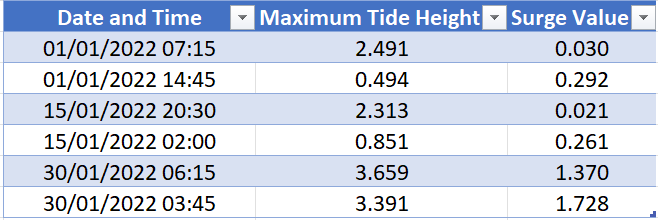
The data in the tables below, shows information for three specific dates, the 1st, 15th and 30th of January 2022. Though it should be borne in mind, that tides could be elevated due to Spring Tides.
Additionally, data in the table below shows the Observed High Water levels and Tide Residuals for January 2015 – 2021.
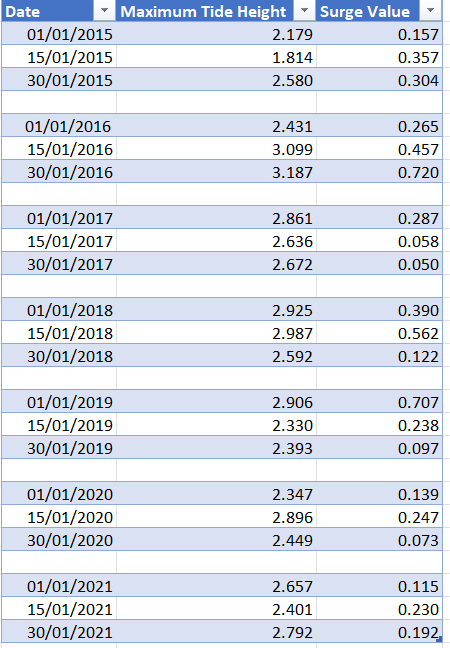
The data in the tables above, shows maximum observed tide levels along with the tide residual figures. These can show whether tide heights correspond with predicted tide levels or whether they indicate a large deviation from predicted tide heights. The lowest tide residual figures show the closest correlation with predicted tide heights and the largest show the greatest deviation. So, on the 15th of January 2017 the Tide height was 2.636 and the Tide Residual figure was 0.058, whereas on 15th January 2018 the Tide Height was 2.987 and the Tide Residual figure was 0.562.
Data showing maximum tide levels and tidal surges gives us a simple insight into tidal conditions for the months and years analysed above. The figures can serve as a useful initial indicator but further analysis is needed to account for weather conditions or the monthly astronomical Spring Tides, which can contribute to elevated sea levels.
However, these figures could contribute to consideration of the possible effects of high water levels such as those experienced in January 2022 on rivers and infrastructure in coastal locations.

2 thoughts on “Lowestoft High Tides 2015 – 2022”