

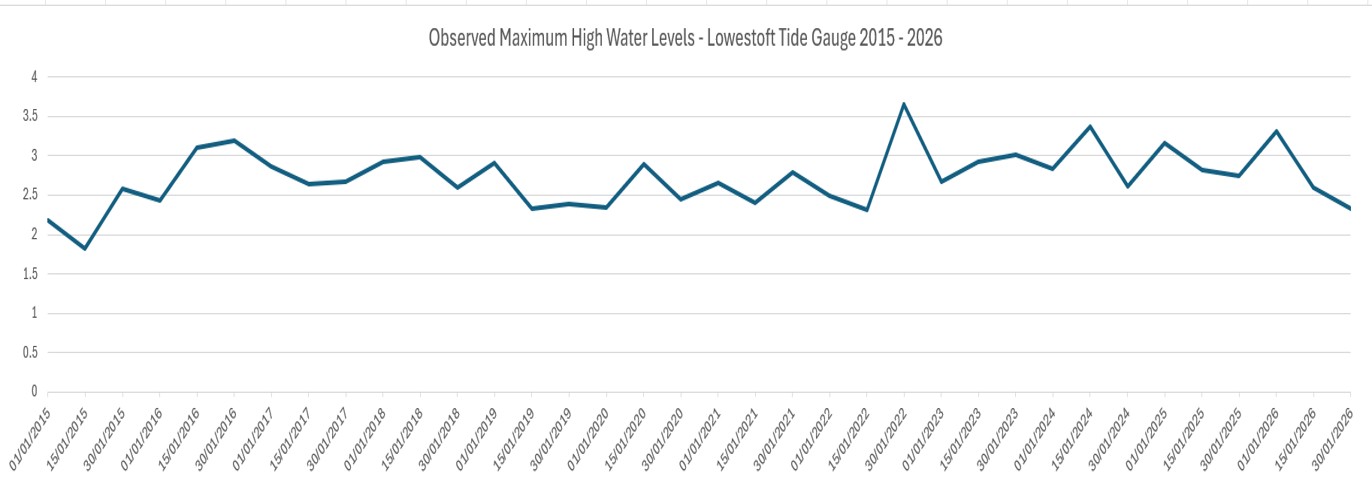
This discussion will look at observed maximum high-water levels recorded at Lowestoft Tide Gauge for the dates of 1st, 15th and 30th January for 2015 – 2026. Examination of high-water levels for the month of January, with the year 2015, randomly chosen as a base point, began when a very large storm surge occurred on 30th January 2022. The surge event remains an extreme outlier for high-water levels recorded during the period studied. Ongoing observations of tide and high-water levels seek to consider long term patterns and contributory factors to sea state variations.
This discussion also coincides with the release of the Met Office State of The Climate report, which gives assessments for Sea Level Rise (SLR). It is thought SLR has risen by around 20.1 cm since 1901. With a rise of about 13.9 cm believed to have occurred in the years 1993 – 2025, though there is uncertainty about the figures for the UK. However, it is not the intention of this discussion to link annual examination of January tidal data with SLR. It is simply the intention to recognise that observations of high-water levels are occurring alongside assessments of SLR, in addition to narratives regarding possible increases in storm intensity. Indeed, the high figure for observed high water on 1st January 2026, seems to continue a pattern of observations of 3 m + high-water values that appear to be grouped within the last four years since 2022. With one 3 m + high-water value recorded in 2016. These high-water examples are mainly related to meteorological conditions that generated storm surges. Though it is also argued SLR could act to amplify the height of the sea, already raised by a storm.
The chart below shows values for observed maximum high-water levels at Lowestoft Tide Gauge on the 1st, 15th and 30th January of 2015 – 2026.
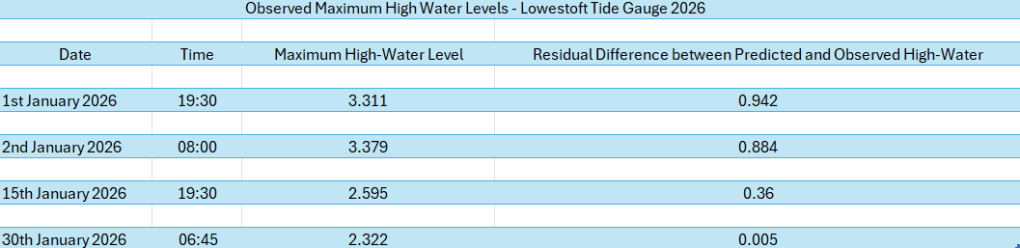
Residual figures on the table for observed high water levels for 1st, 15th and 30th January for 2026, indicate the difference between predicted tide heights and observed high water levels.
As the values for observed high water levels are simply a snapshot, it is useful to compare the figures with predicted tide hights for the dates of 1st, 15th and 30th January 2026. Data is kindly provided by the National Oceanography Centre, Commercial Software and Data (CSD).
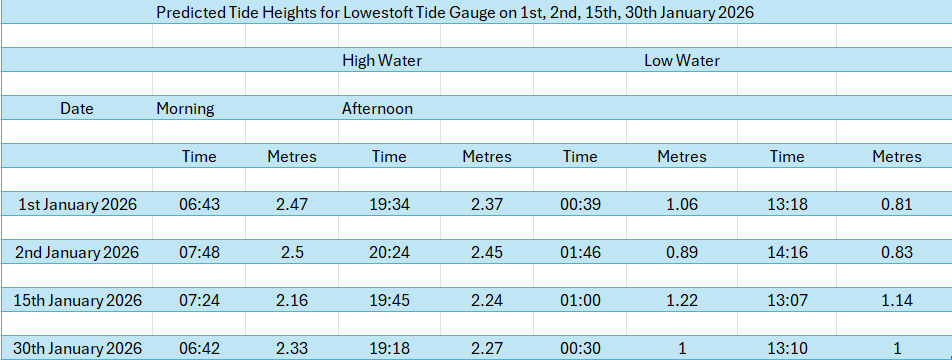
Comparison of observed high water levels and predicted tide heights can be useful for enabling an evaluation of different values from the same tidal gauge for the dates studied. The sea is a fluid body, and it is not surprising that there might be variations between forecast heights and actual sea behaviour. For example, on 1st January, predicted tide height for 19:34 pm was 2.37 m, but the observed high-water level at 19:30 was 3.311 m. The residual difference between predicted and observed was 0.942.
On 15th January, second predicted high tide was at 19:45 with a level of 2.24 m and the value for observed high water was 2.595 m at 19:30 pm. The residual difference between predicted and observed was 0.36 m. For 30th January, first predicted high tide was at 06:42 with a level of 2.33 m and observed high water was at 06:45 am with a level of 2.32 m. The residual figure recorded by the British Oceanography Data Centre give the residual difference between observed and predicted as 0.005 m.
The high-water value for 1st January was recorded around the time a large storm surge travelled down the North Sea Coast that continued for two tidal cycles on 1st and 2nd January 2026. This discussion will briefly look at observed high water levels and predicted tide heights for 2nd January 2026. At 08:00 on 2nd January, the value for observed high water was 3.379 m and predicted high tide due at 07:48 was 2.5 m. The residual figure for the difference between observed and predicted was 0.884. The first predicted low tide on 2nd January was due at 01:46 am with a height of 0.89 m. Observed high water at 3:15 am was 2.556 m with a residual difference between predicted and observed of 1.326 m. Although not covered in this discussion, these figures also offer an opportunity to consider tide-surge interactions.
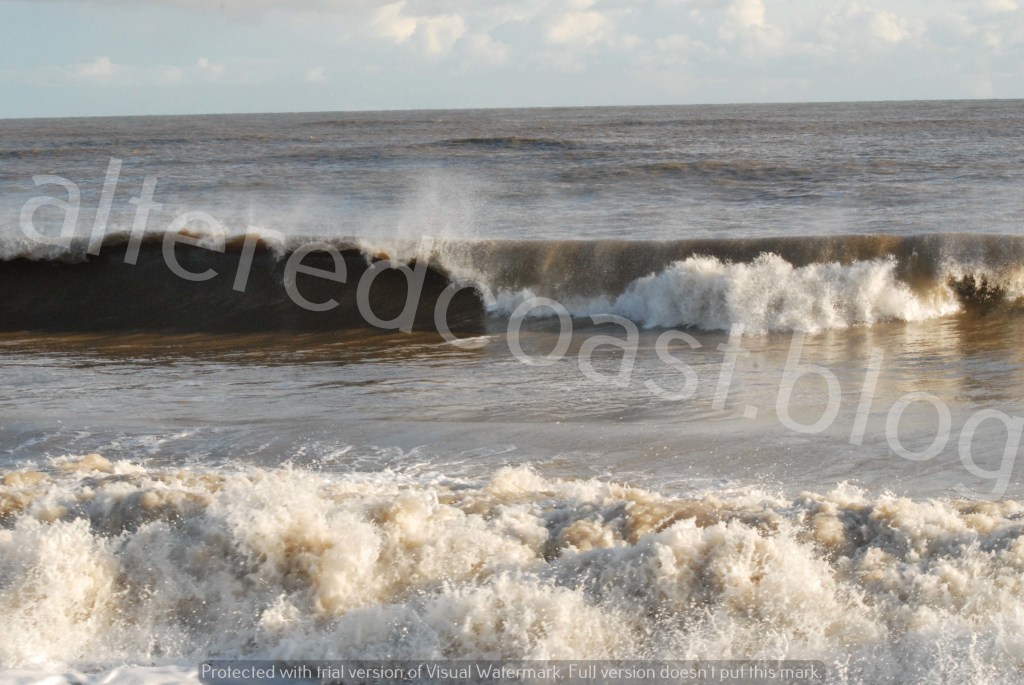
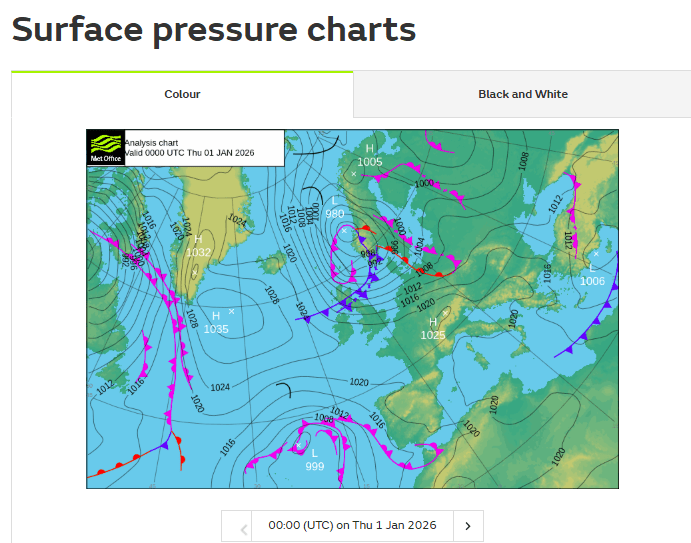
This discussion will very briefly consider conditions that could have generated a surge. On 30th December 2025, the Met Office Deep Dive, (a weekly YouTube presentation from meteorologists giving useful insights weather patterns) forecast strong arctic northerly winds for New Year. The shipping forecast for 31st December – 1st January predicted Westerly Gale force 8/severe gale force 9 winds, veering North Westerly. Met Office Surface Pressure charts showed a low-pressure system of 981 mb to the north of the UK. With tight Isobars signifying very strong winds for North Sea coasts.
The wave and weather gauge at Happisburgh, is part of the National Network of Regional Coastal Monitoring Programmes. The gauge records data concerning sea state behaviour, 24 hours a day, at 10-minute intervals. From midnight on 1st January to around 8 pm on 2nd January 2026, wind gust speeds of 20 knots increasing at times to 28-32 knots were recorded with wind gust speed of 10-16 m-s at times. Wind speed values for gust speeds in knots and metres per second (m-s) can be converted to Beaufort Scale measurements.
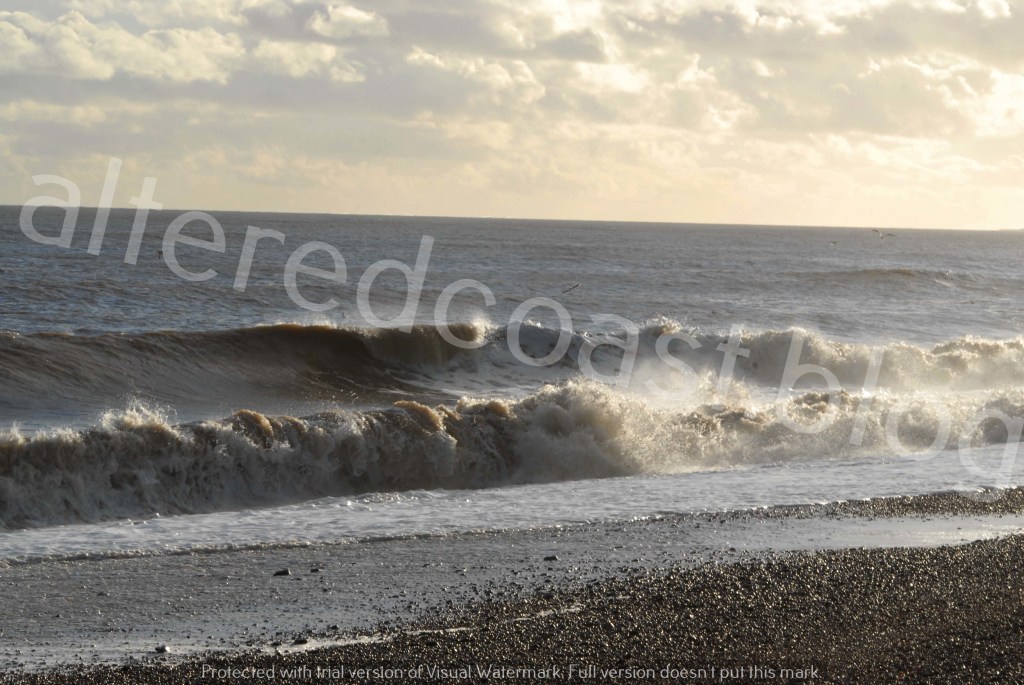
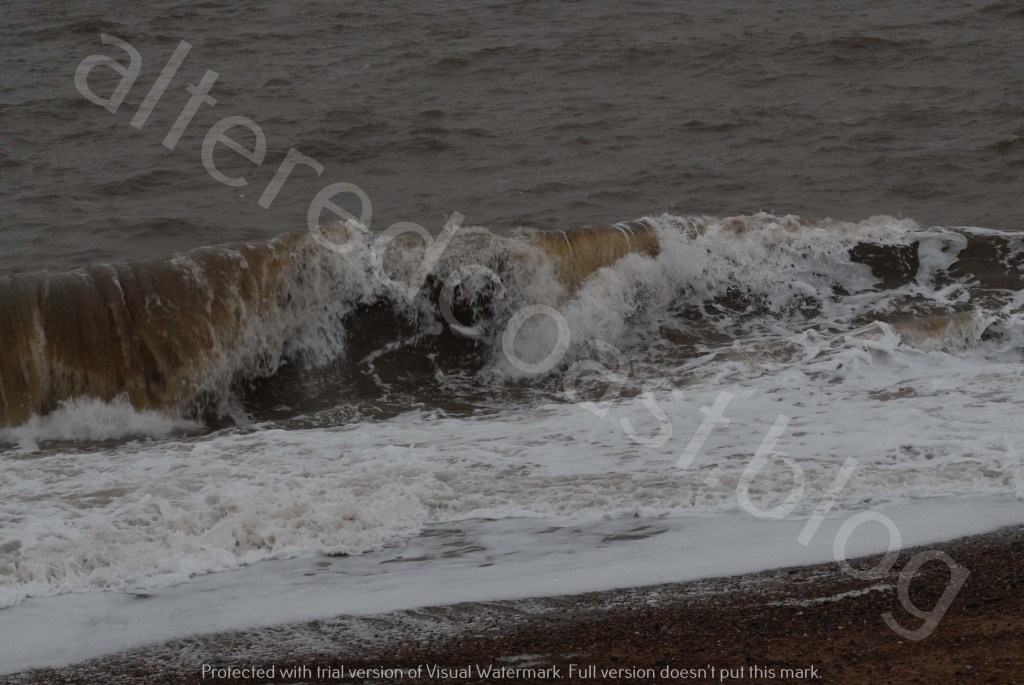
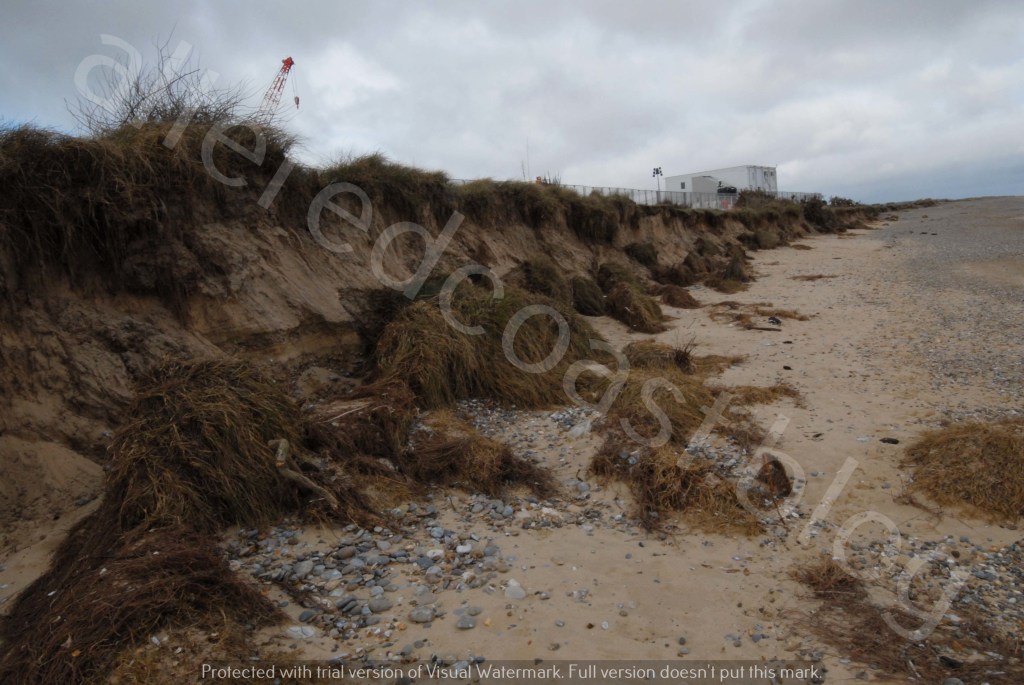
The Shipping Forecast and Surface Pressure Charts give an indication of weather conditions, with Northerly/North-West winds capable of transmitting forceful wind speeds into sea water. But at the point a surge hits the coast, it isn’t necessarily the case weather conditions will be stormy. Active conditions that generate surges, can transfer powerful processes through sea water onto beaches to initiate sediment movement and erosion.
This discussion has considered high water levels for three dates in January 1st, 15th and 30th for 2015 – 2026 and the values have been compared to predicted tide heights, including those for 2nd January. The context for fluctuations in sea elevations has been considered, including meteorological conditions, the increasing intensity of storms, and assessments of sea level rise. As the twice-daily flow of the sea can be seen as a barometer of times of year, weather conditions, and interpretations of its impact on landscapes and infrastructure. It is useful therefore to study the elevations in the sea, and consider likely influences. As the actions of the sea seems to be felt ever closer like the oscillations of the tide.














 alteredcoast