
This discussion will combine analysis of annual January tide data from 2015 to the current year, with further consideration of the 1953 storm event, to consider the usefulness of a Skew Surge. The total difference between Maximum Predicted Astronomical Tide and Maximum Observed High Water.
To begin with a look at annual observed Tidal High Water (HW) data for Lowestoft, from January 2015 to the present, each year the chart is updated to show annual tide data for the dates of 1st, 15th and 30th of January. The data for 2023 can be seen towards the end, on the right-hand side of the chart. For the 1st January, maximum observed tidal HW was 2.665 metres, for 15th January, it was 2.918 metres and for 30th January, the value was 3.019 metres.

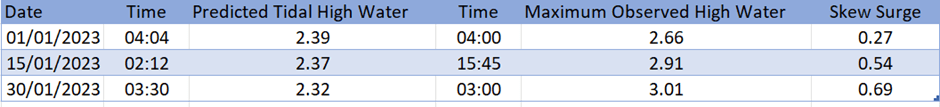
To consider the skew surge, for the dates in January 2023, the table below shows the values for Maximum Predicted Astronomical Tide and Maximum Observed HW, and the Skew Surge for these dates. The figure for the skew surge is obtained by calculating the difference between the Maximum Predicted Astronomical tide and Maximum Observed HW.
It is interesting to note how values for 1st January and 30th January, occur quite close to predicted tidal HW, though a skew surge value applies whatever time it occurs within the tidal cycle. This useful to note, as recent flood warnings at the end of February highlighted that a storm surge can occur either side of predicted high tide. A diagram from a paper to discuss tide and surge independence illustrates the position of a skew surge, in a tidal cycle.

A skew surge can occur on any tide, and occurs independently, as the value only shows the difference between predicted and observed HW. So a Skew Surge could be framed as analysis of what constitutes the elevated portion of HW, the factors that create this elevation, and its significance in storm analysis.
To consider this, the Skew Surge on 15th January 2023 can be used as an example. Maximum Predicted Tidal HW of 2.37 metres, occurred at 02:12 am, and Maximum Observed HW at 15:45 pm. Low pressure dominated, ranging from 995 to 1993 mbar, winds blew from a Southwest to Northeast direction, wind speeds increased from 18-20mph at the start of the day to 24 mph around 09:20-11:20 am.
Weather conditions can help explain a rise in observed sea level. Especially because on the January 2023 dates, all three tides were Neap Tides, when tides are smaller than usual. Regarding the 1953 storm, the scholar Steers in 1953 wrote that surge conditions in 1953 could have been even more serious had the surge occurred on a high Spring Tide. Steers states predicted Spring Tides were around 1-3 ft less than occur at other times of the year. This suggests the main cause of damaging sea levels in 1953 were meteorological conditions on the night. The Skew Surge on 31st January 1953 was 2.41 meters at Lowestoft, whereas in 2013, the skew surge was 1.98 metres, even though the astronomical Spring Tide was higher in 2013.
A Skew Surge can contribute to analysis of a storm by indicating likely presence of specific, local conditions capable of generating dangerous surge conditions. But further information is still needed to ascertain its significance. Predicted tide height, levels of low pressure the breadth and duration of a surge, whether high water was still or agitated, wind speed and direction, all important indicators of the severity of a storm.
Values for Observed Tidal HW, in the January chart and the Skew surge for the January dates, show elevated sea levels and indicate the particular nature of a surge. These characteristics can contribute to an understanding of troubled sea levels and the power of the infamous surges of the North Sea.
