Coastal storms: Processes and Impacts. Editor Paolo Ciavola, Giovanni Coco
Winter erosion, as with many places on the UK coastlines, has been severe on the East Anglian coast. Locations like Hemsby saw 10 metres of dune loss in one night due to a storm surge on 2nd January. At Thorpeness, it is thought around 27 metres of cliff have been lost in a little over two years. Therefore, this first look at Winter Erosion, will firstly consider Thorpeness, with thoughts suggesting wider considerations about severe erosion on the East Anglian coast.
At Thorpeness around 5 homes have tragically been lost since October 2025, with the continuing erosion so severe and large-scale it defies comprehension. The loss of memories and beach, so sudden and dramatic, words don’t seem enough to describe what has occurred. Nevertheless, this discussion will consider contributory factors to the erosion, with a view to asking whether for Thorpeness and the wider coastline it:
‘marks severe discontinuities; what comes after will not be like what came before’
– Donna Haraway – quoted in PhD on Coastal Erosion Poetry Hold The Line by Alison Stoneman.
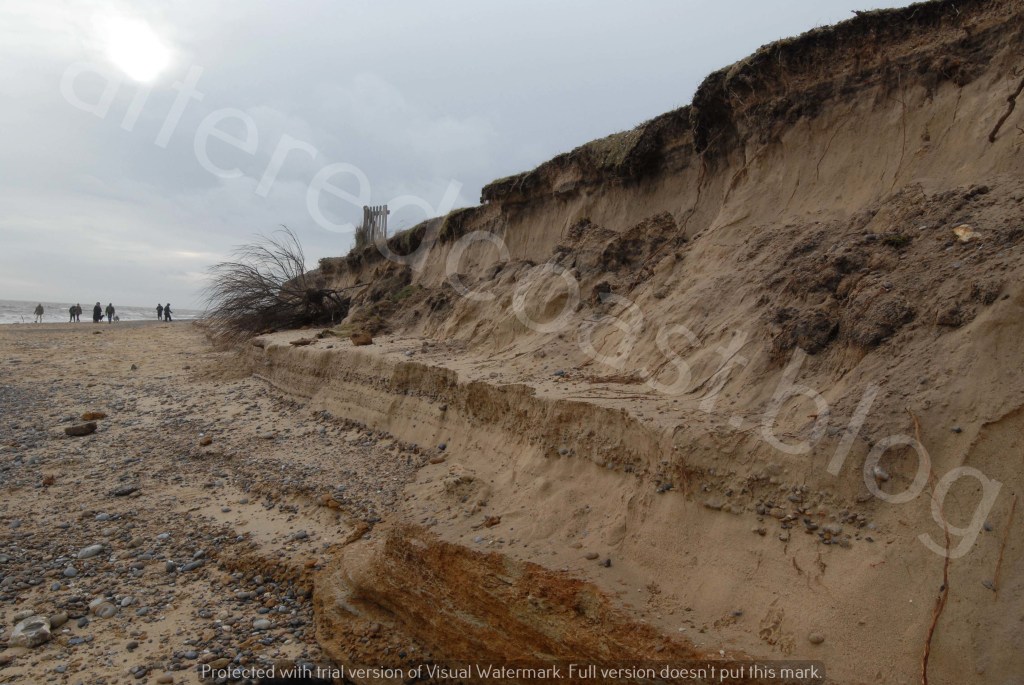
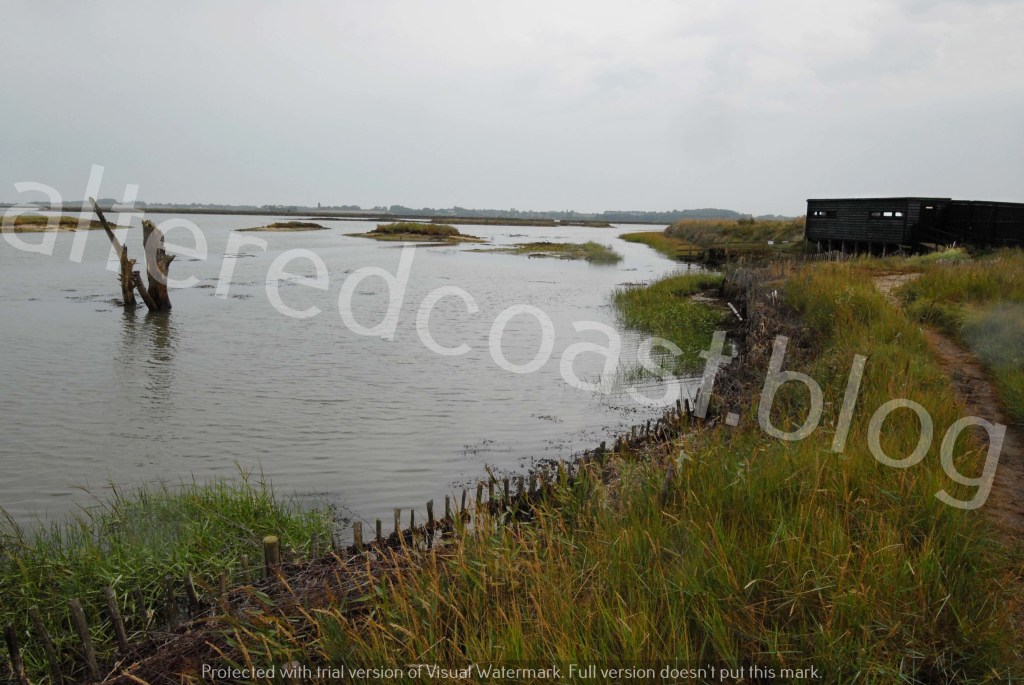
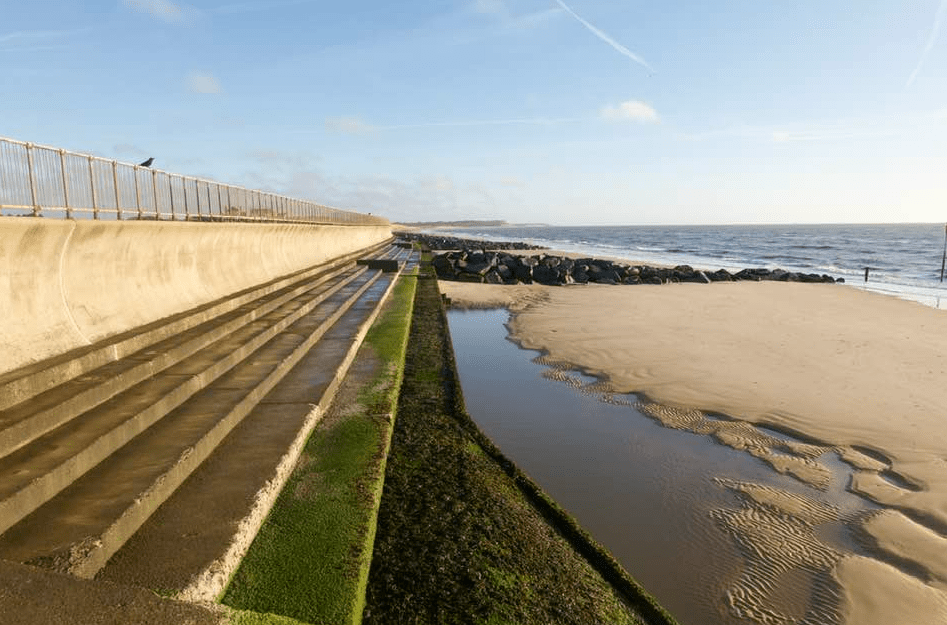
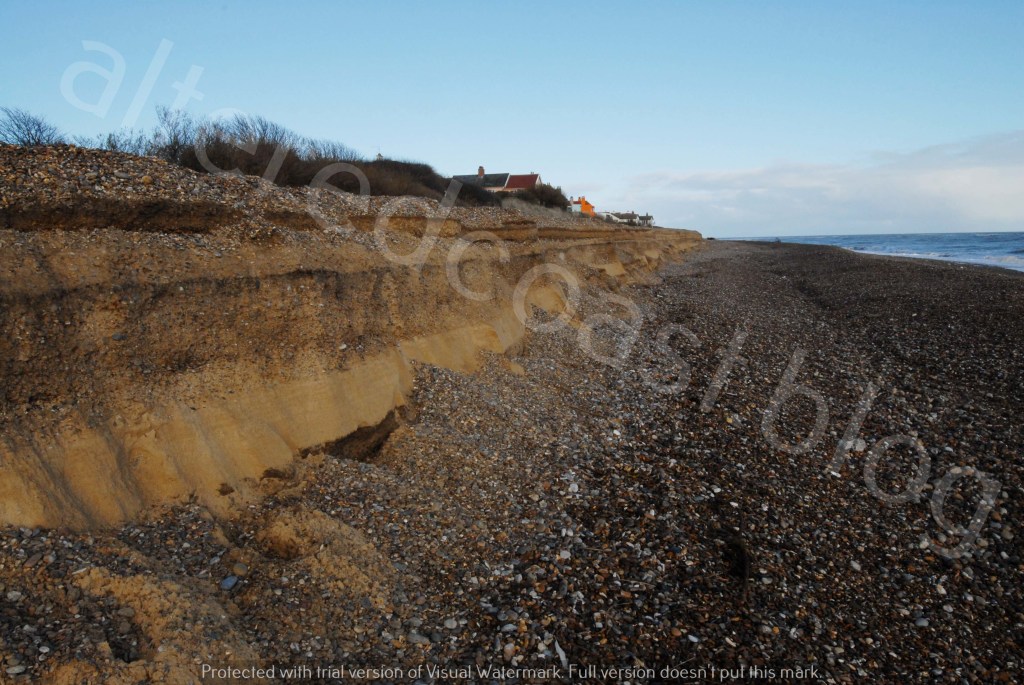
The main features Erosion at Thorpeness include a large quarry shaped cliff retreat, creation of Scarps, and complete removal and stripping away of beach material. Processes contributing to the formation of each feature will briefly be discussed.
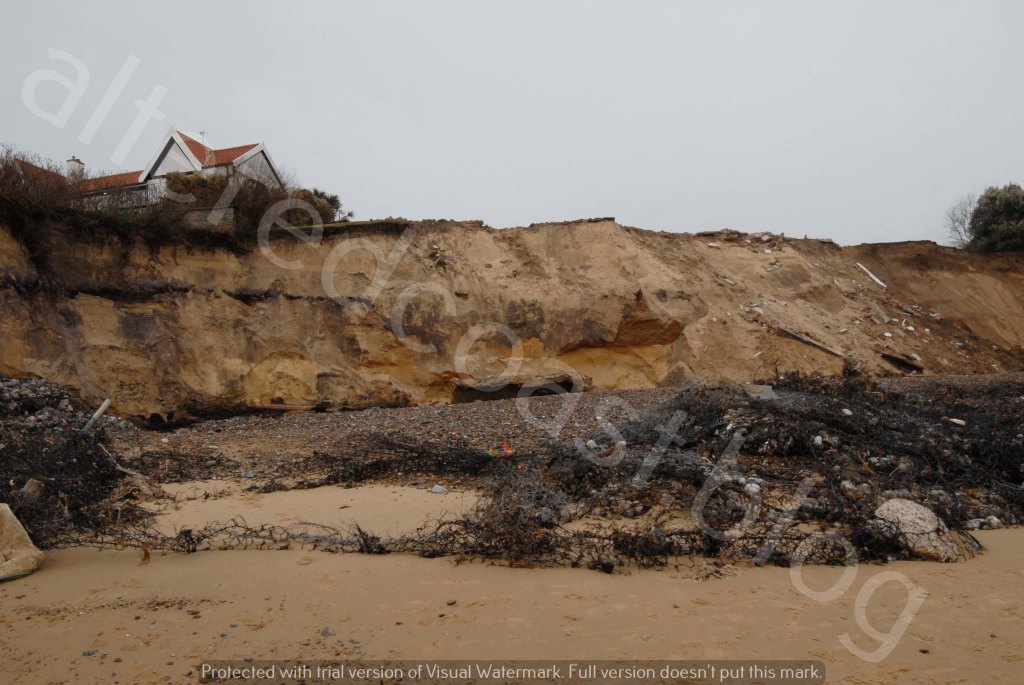
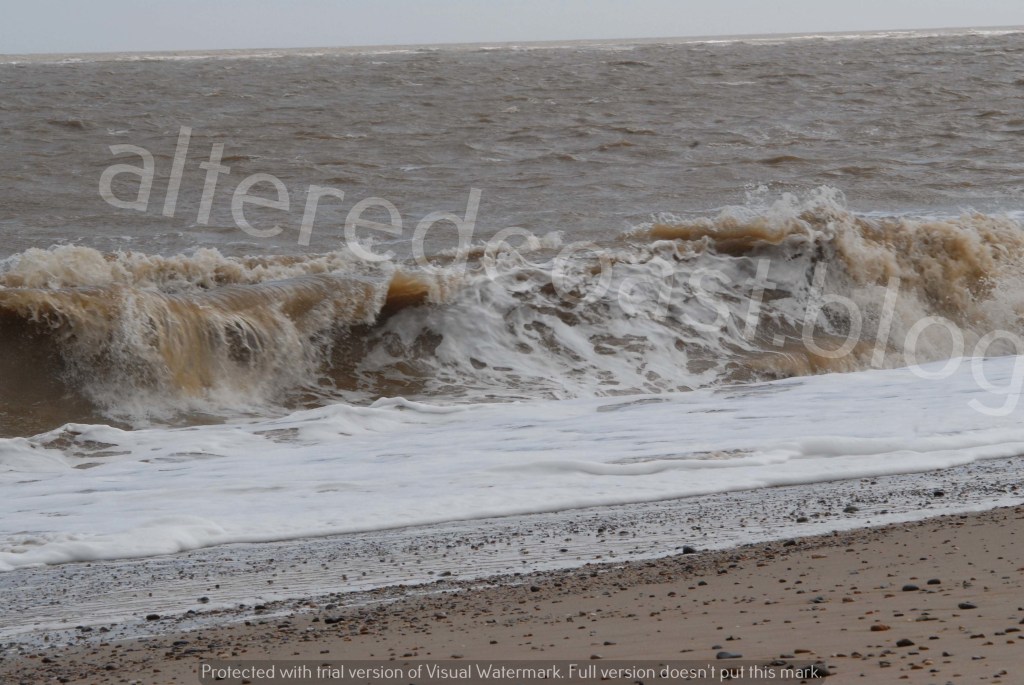
Firstly, it would seem necessary to consider the Aggregated Surplus Strength of sea states energised by wind and weather. The weight and power of such waves can propel a strong column of Water directly against a cliff surface. Residents at Thorpeness talk of hearing vibrations deep inside the cliff structure when powerful waves hit the cliff frontage. Such powerful action can scour and over-steepen cliff surfaces, creating instability, causing sediment to collapse. Additionally, another version of this process is the creation of steep cliff features on the cliff frontage. With the amount of sediment moved related to the magnitude of the clash of Swash waves against the cliff.
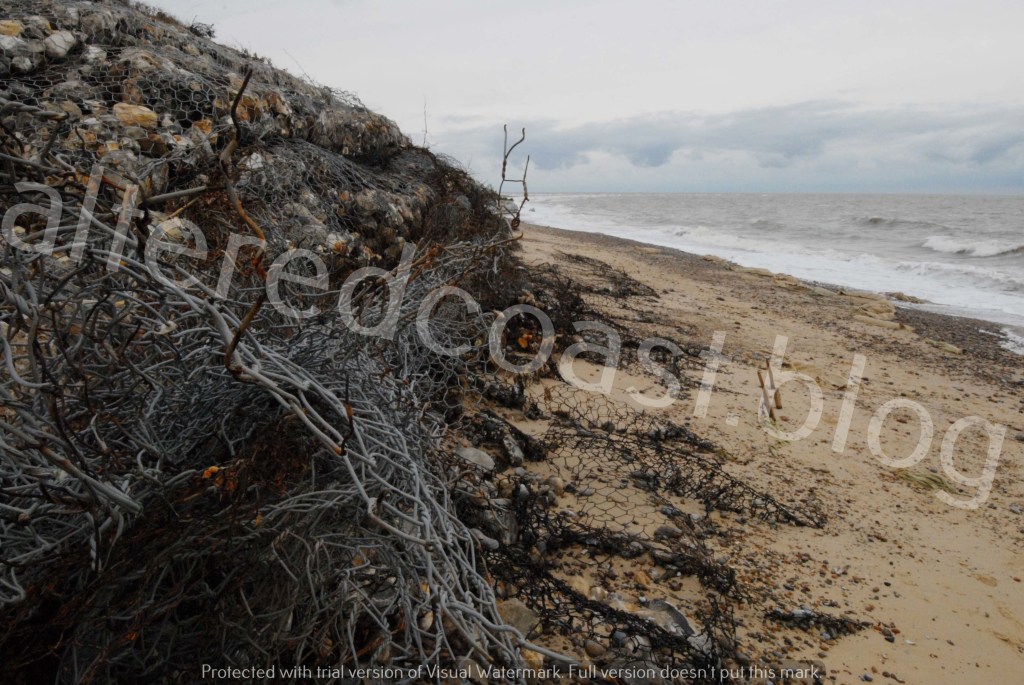
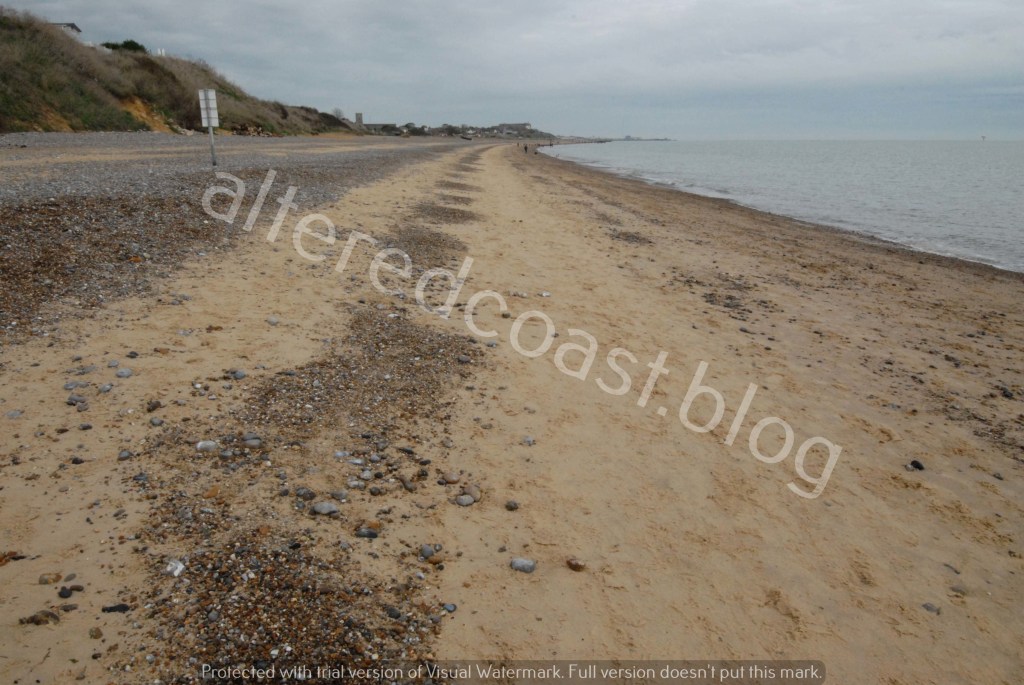
This moves the discussion down the beach slightly to a location known as Tinkers End. But as the discussion moves to a new area, it takes something with it in the form of sand. With a tentative suggestion that severe erosion of cliffs predominantly formed of sand, could have released sand into the beach system. This could have affected the structure of the shingle. Potentially creating a damaging feedback loop.
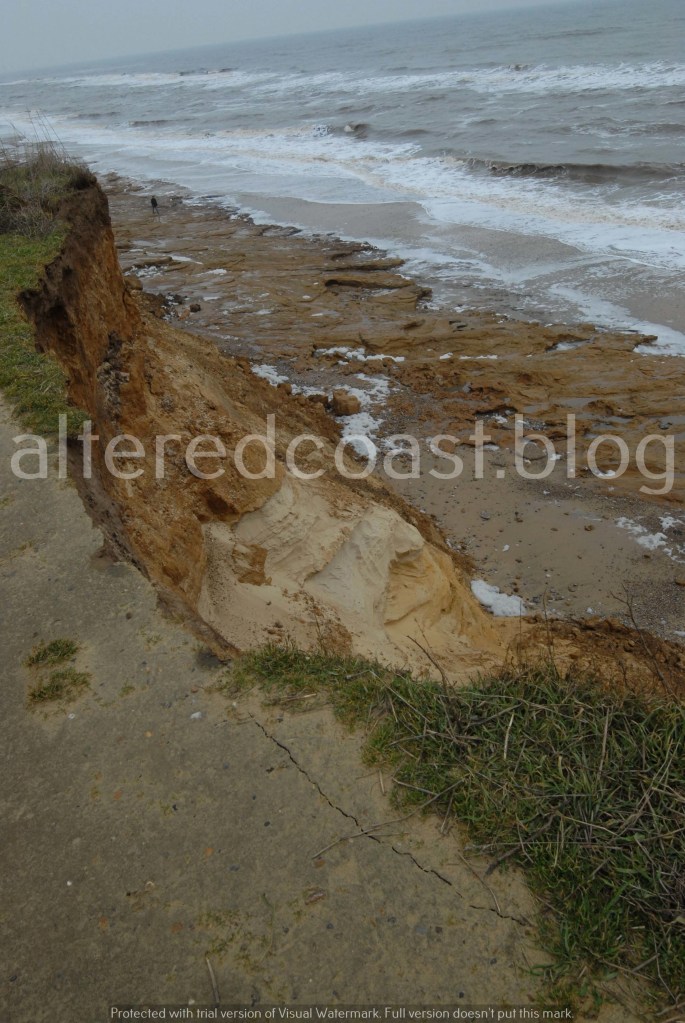
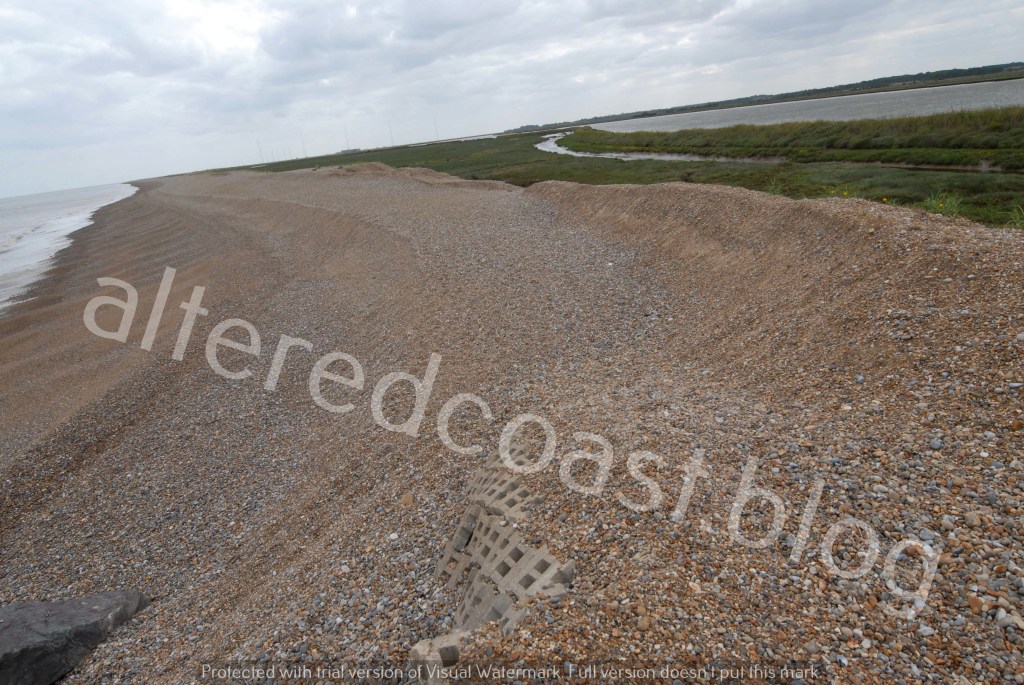
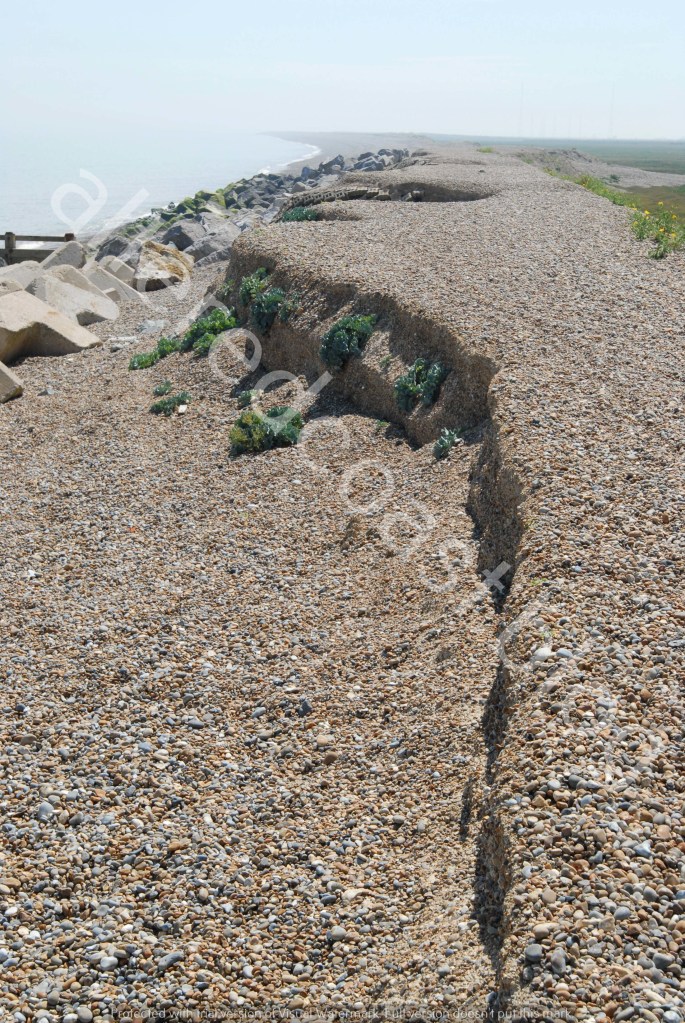
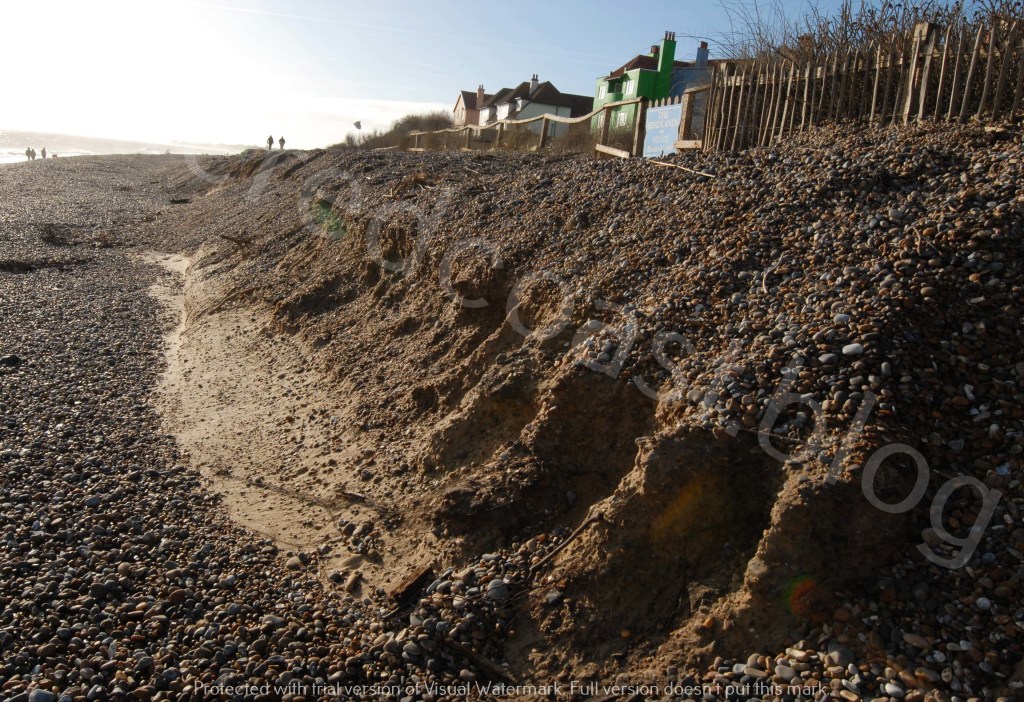
As, it is thought shingle beaches can be permeable, as sea water in the Swash as it runs up the beach can infiltrate into shingle. But if sand filters into the space between the shingle this could limit the permeable characteristics of a shingle beach. This could relate to the formation of Scarps, features that were visible at Tinkers End on 30th December 2025.
A Scarp can form when energetic Swash waves erode into a shingle ridge on a beach. Subsequent saturation of sand within the shingle, can causes a collapse of sediment, which along with erosion of beach surface, can steepen the emerging Scarp. As swash waves continue to cut into the Scarp, it becomes steeper and can move landward as more sediment is eroded from the base of the Scarp.
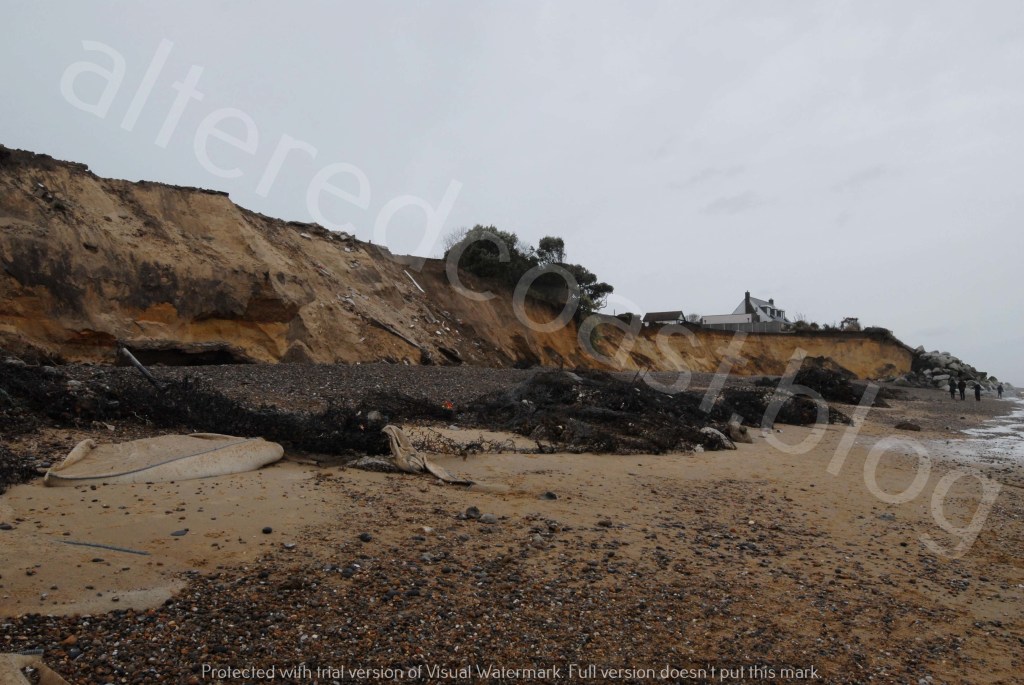
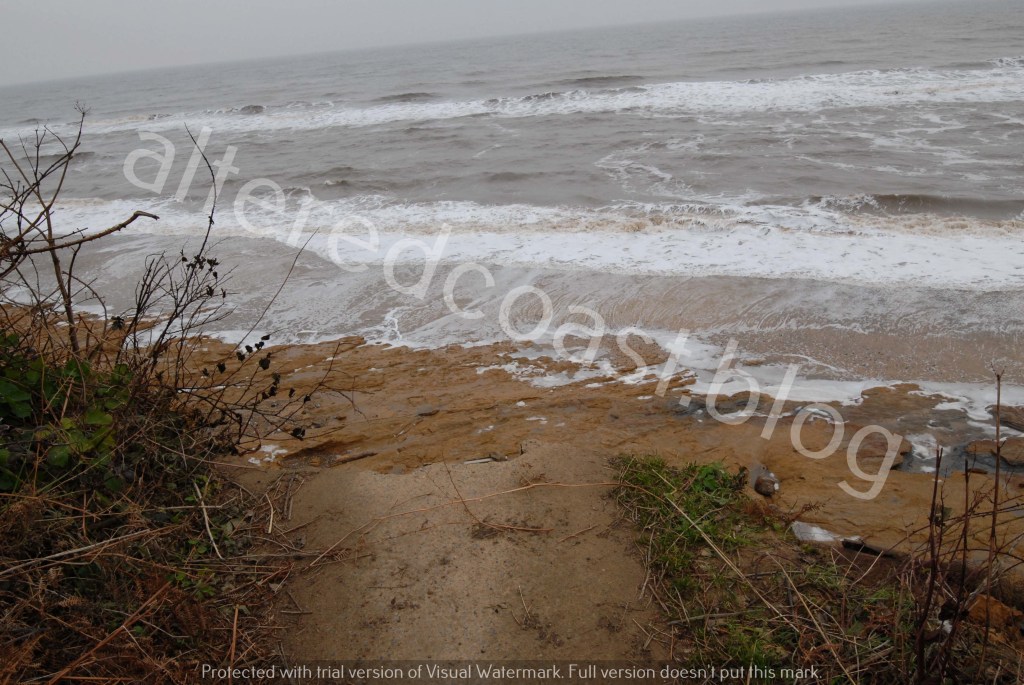
Two days after the Scarp was observed at Tinkers End, a very powerful storm surge, that lasted for two tidal cycles on 1st and 2nd January 2026, swept down the East Anglian Coast. The following images shows the two beach states before and after the storm surge. The first image was taken on 30th December 2025:
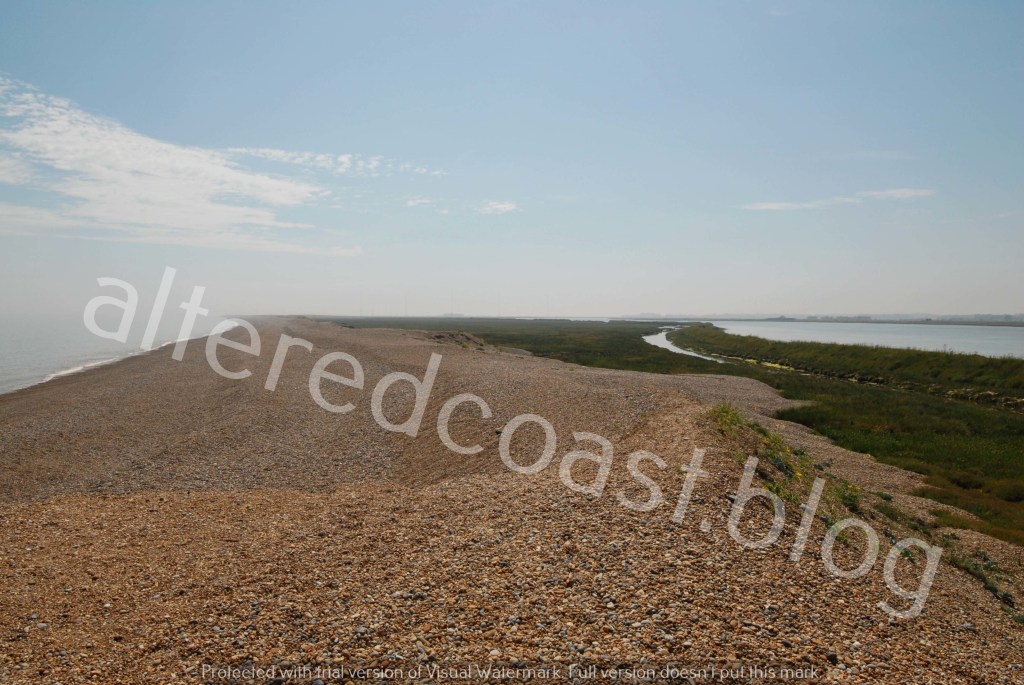
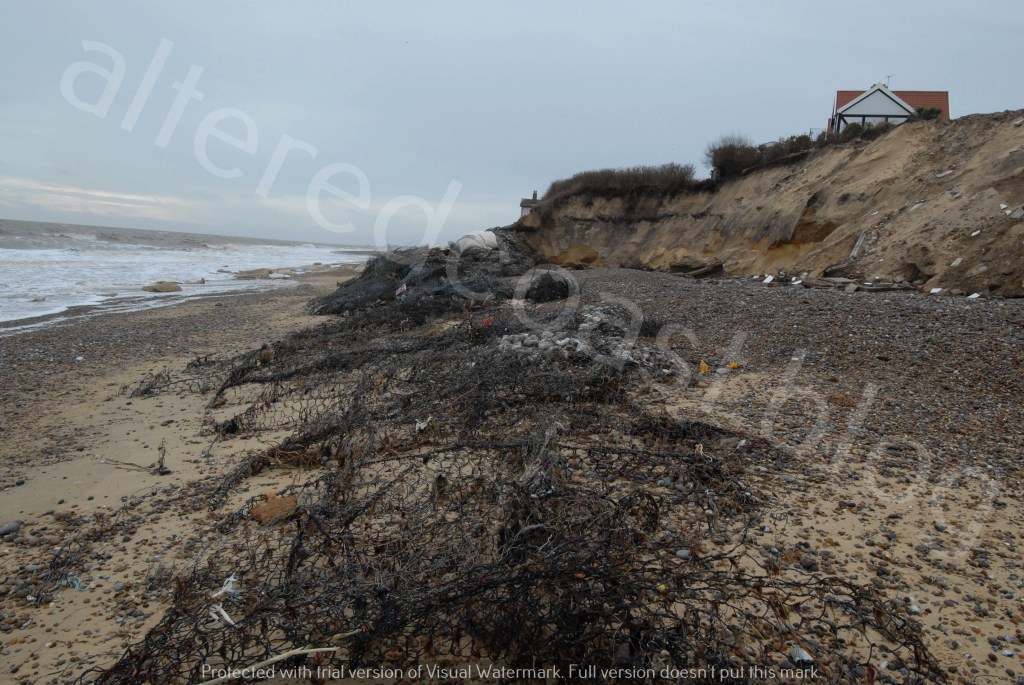
The second image was taken on 11th January 2026.
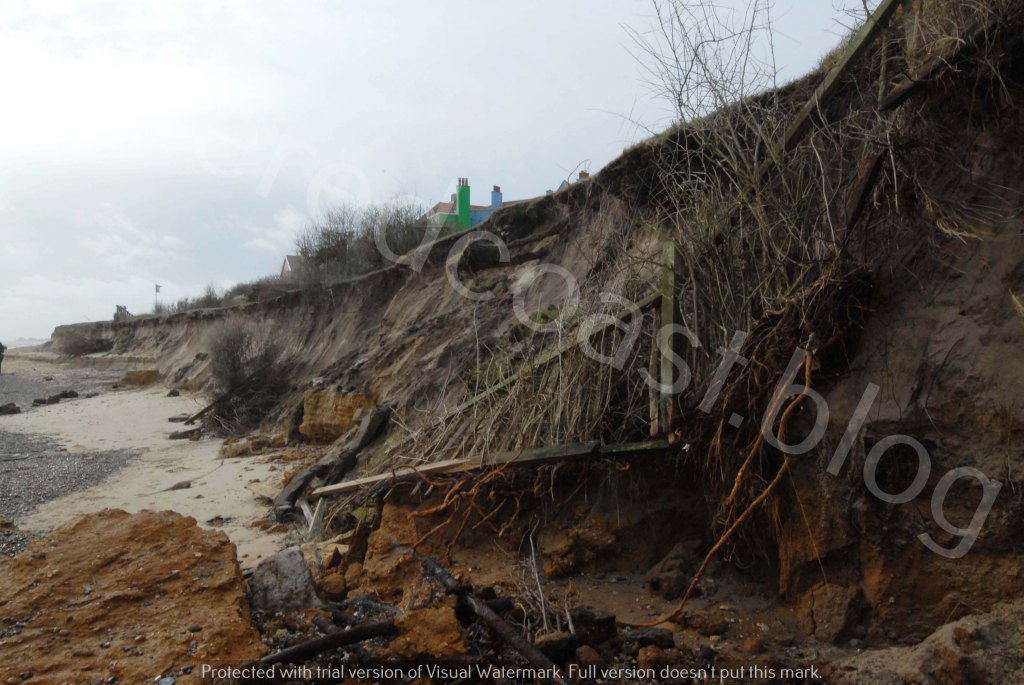
The surge severely escalated the erosion at Thorpeness, particularly at the area where the Scarps had formed, with the steep cliff features pushed much further landward. Additionally, large volumes of beach material were completely stripped from the beach. Exposing the Red Crag or Coraline Crag which is thought to underlie the beach surface around Thorpeness and Aldeburgh.
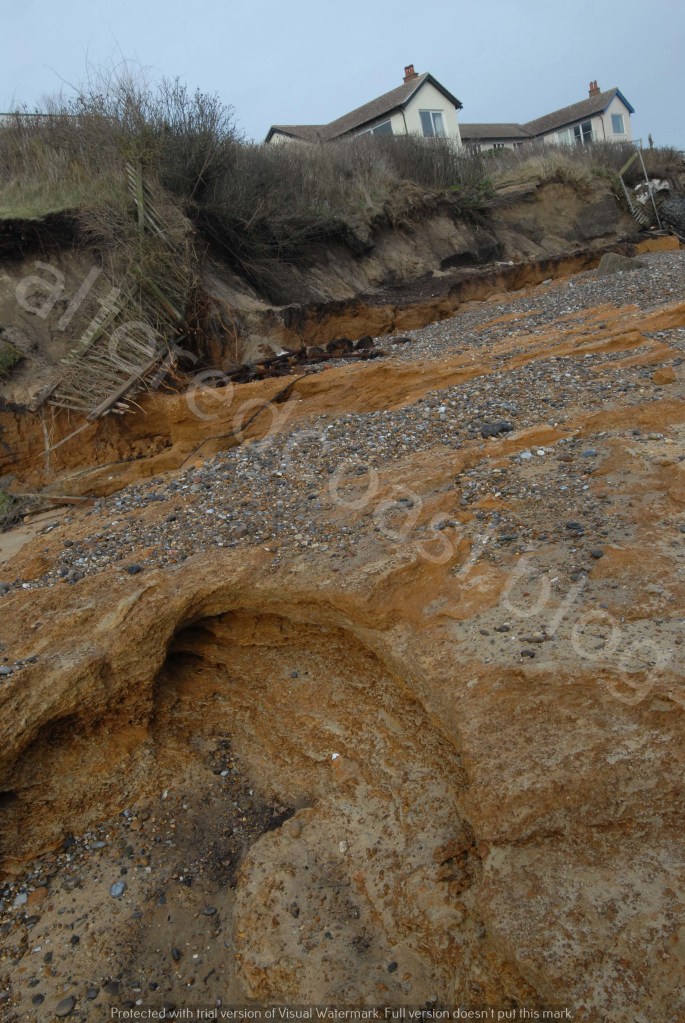
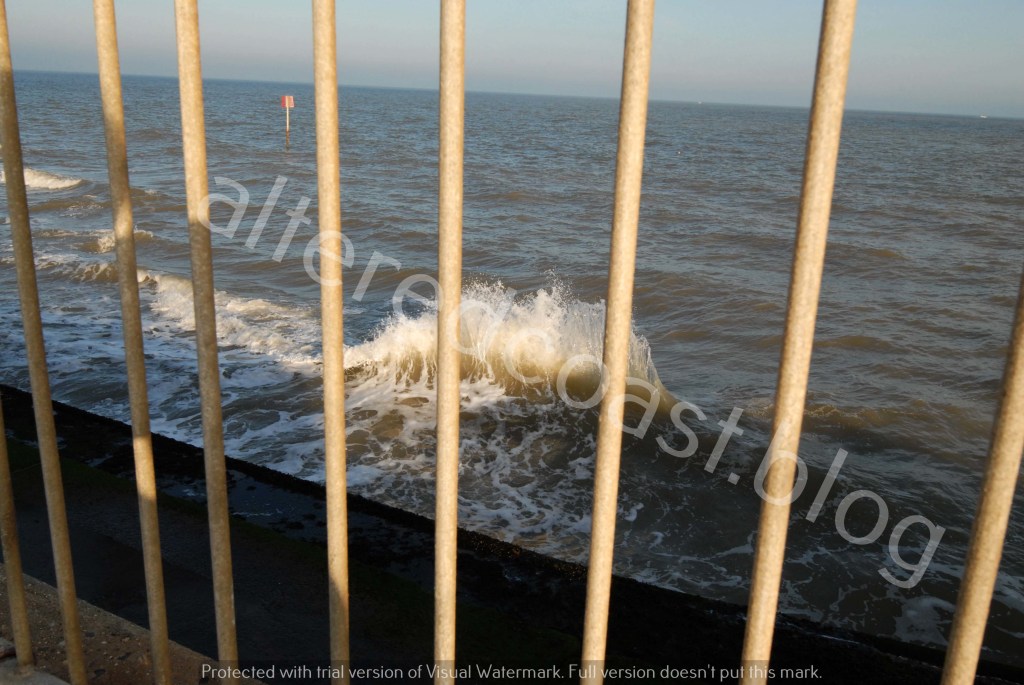
Forceful waves and surges can exploit existing weaknesses on beaches or create new fragilities. With beach surfaces and current and new infrastructure built close to the edge of the beach, possibly becoming increasingly vulnerable to forceful wave action. As sea states look likely to increase in intensity due to climate change. As coastlines and people experience acute departures from lives once thought to be solid. As futures are increasingly caught in the turbulent boundary between sea and land.