This discussion will continue looking at the concept of Total Water Level by taking an annual look at observed high water levels for the 1st, 15th and 30th January for the years, 2015-2024.
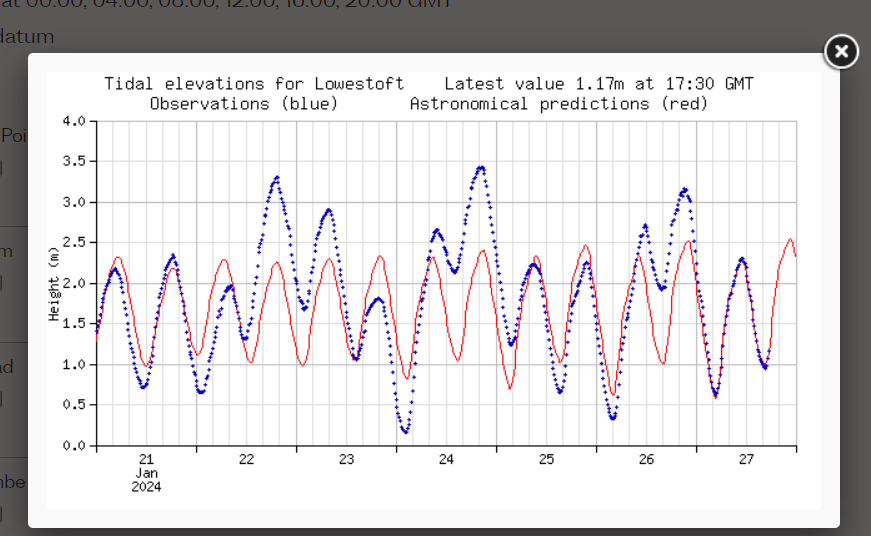
As the data from January 2024 coincided with a period of intense stormy weather, this discussion will look at features of sea states in stormy conditions. As a framework for this discussion, a period of five days from 22nd-26th January, will be considered, when Storm Isha and Jocelyn followed each other in quick succession. Over five days, 3 Surges were recorded at Lowestoft, measuring at least 1 metre in height with significant negative surges also occurring.
This discussion will consider the formation of positive and negative surges in relation to the intensity of the dialogue between wind, sea and low pressure. These elements will be assessed, to begin an ongoing consideration of whether they indicate the possible energy levels, that could be thrown against a coastline, during a storm.
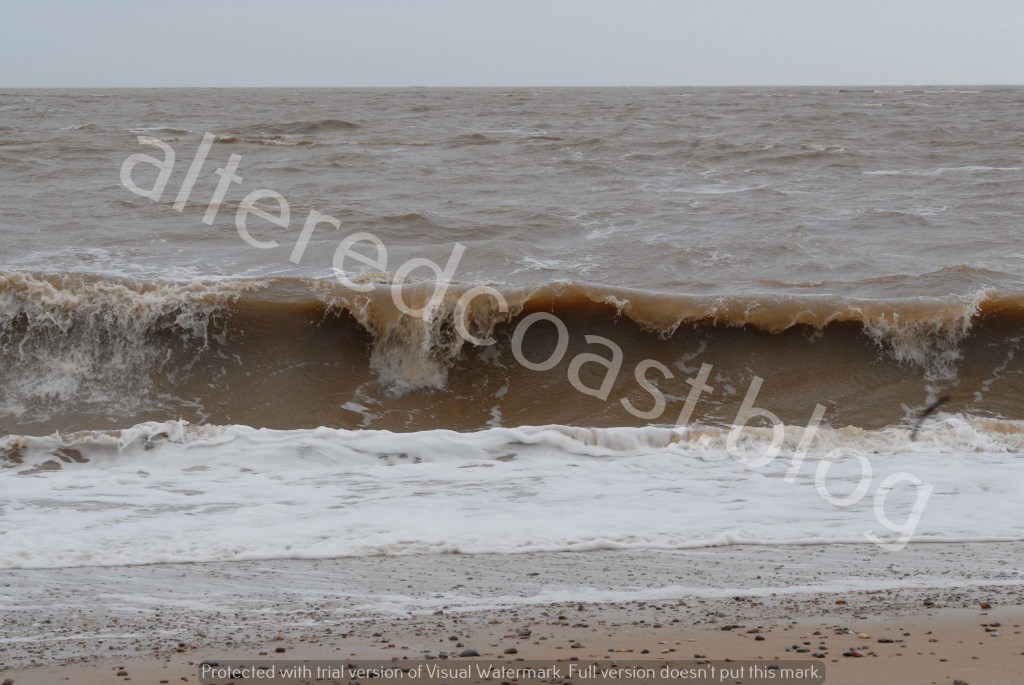
Firstly, to look at annual Tidal data of Observed High Water levels from 2015-2024, collected for 3 dates, the 1st, 15th and 30th of January.

One noticeable value is the figure for Observed High Water for 15th January 2024. This the second highest value for OHW for the dates and years studied. However, the data should be qualified, as the value was recorded at midnight on January 15th, which was half an hour after High Tide on January 14th. It should also be noted that Sunday 14th January was a Spring Tide. The Surge that was recorded for January 14th, which appeared to persist for 3 Tidal Cycles, has been considered in earlier discussions about Storm Surges.
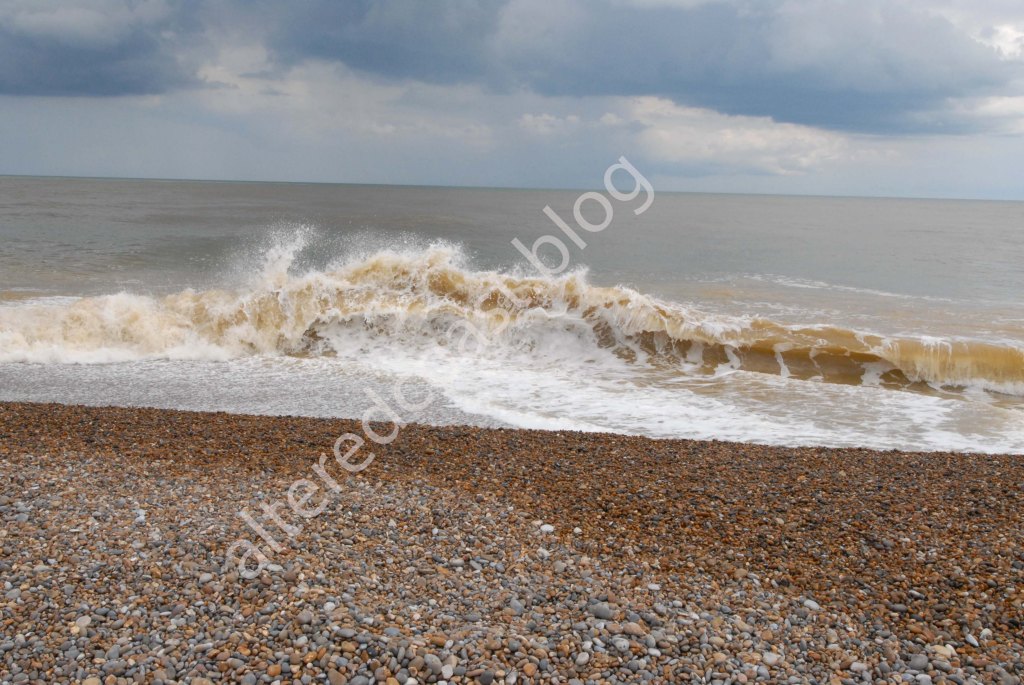
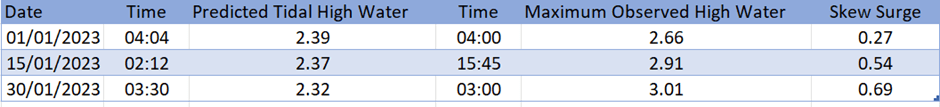
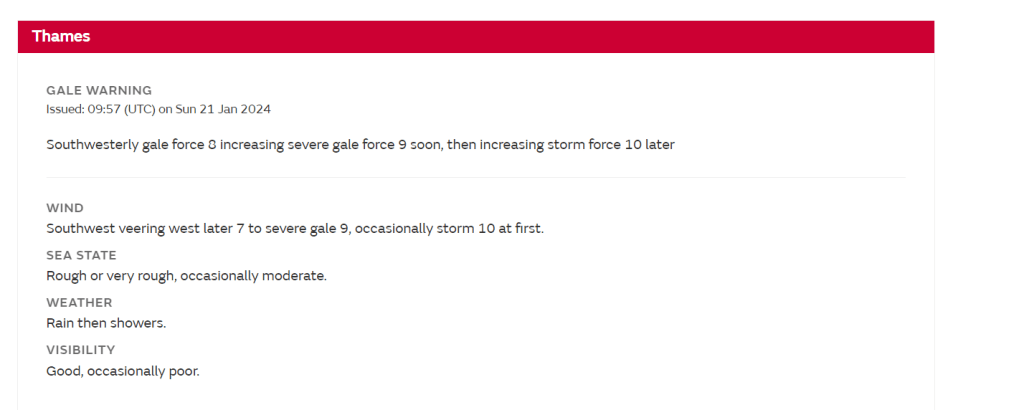
Looking now at the week of January 21st-26th, focus will be given to the Surges on Monday 22nd and Wednesday 24th January. The start of the week, which was a Neap Tide on Sunday 21st January, was dominated with the arrival of Storm Isha. The images below give an indication of sea state and weather pressure systems in the hours before Monday 22nd January.
Firstly, the Shipping Forecast for the Thames area.
Secondly, the UK Met Office Surface Pressure forecast for midnight on Monday 22nd January 2024.

It should be acknowledged that Storm Isha was a particularly intense, powerful event, so should be seen as an extreme example outside of the usual occurrences of surge incidents during Neap tides. In terms of sea state conditions, the table below, gives a snapshot of the main values that suggest the conditions present in the Southern North Sea. Values were recorded at Lowestoft and Happisburgh on Sunday 21st January and Monday 22nd January 2024.

These values indicate the individual conditions present at specific points, but it is also worth noting the duration of intense storm conditions. At Happisburgh, Low Pressure dipped to 999 mb at 7:50 pm on Sunday 21st January, and remained below 1000 mb until 08:20 am on Monday 22nd January. Wind gust speeds rose to 47.1 knotts at 17:50 pm on Sunday 21st January and gust speeds of over 40-50 knotts continued until 2:10 am on Monday 22nd January. It could be inferred that the wind speeds, and deepening of low pressure, hint at energy levels capable of creating the high values for SWH and Wave Power.
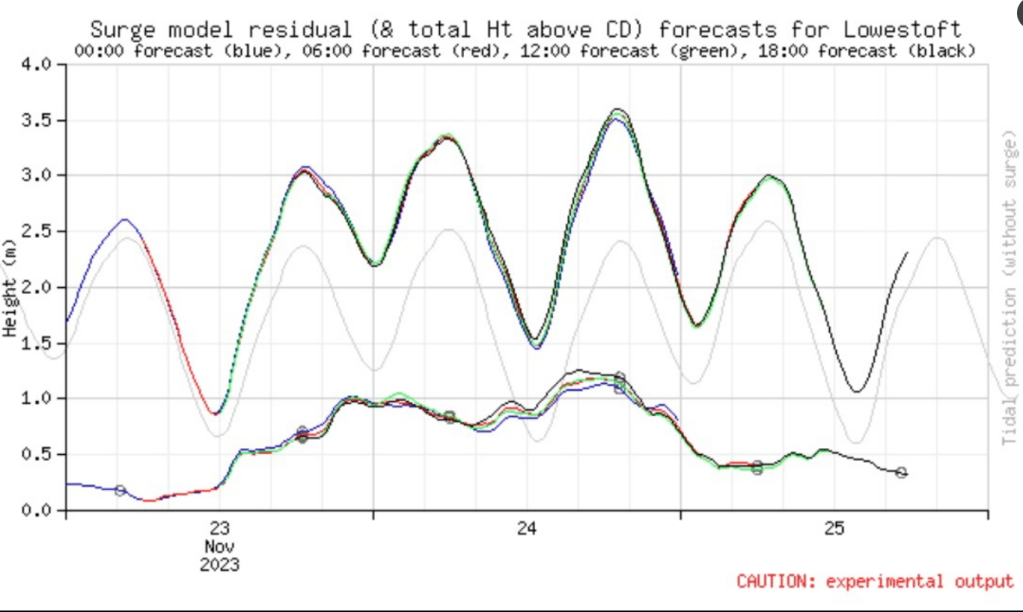
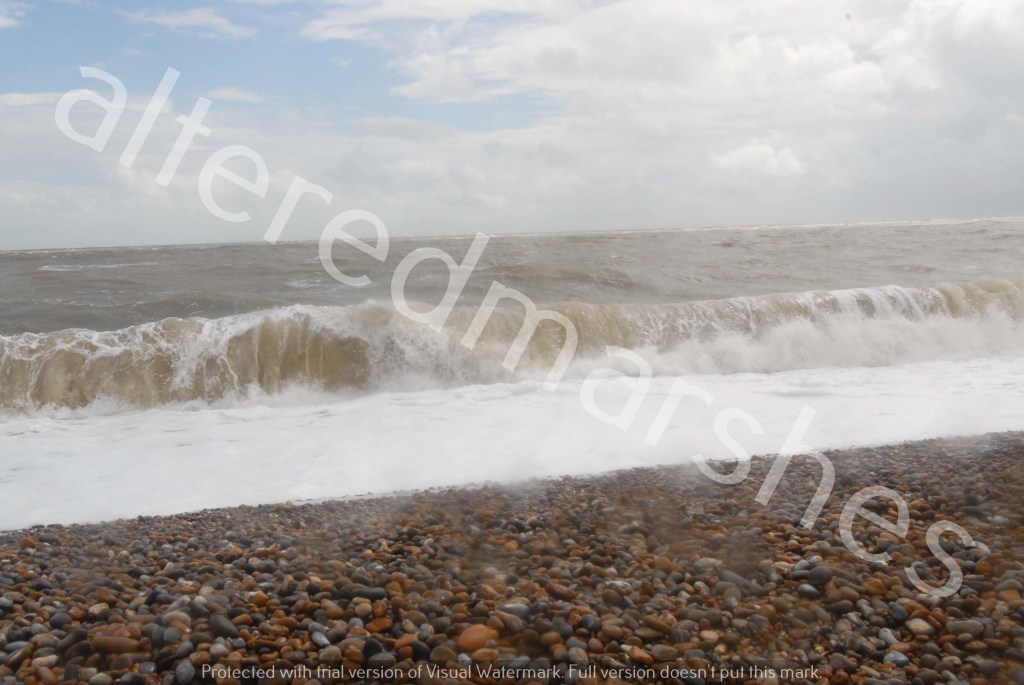
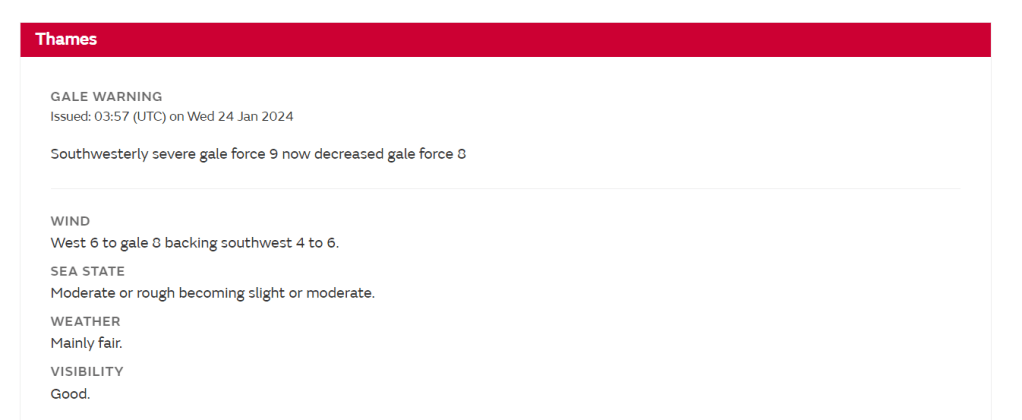
However, wind speeds and wave heights were much lower in the lead up to the largest surge of the week on Wednesday 24th of January, when Storm Jocelyn hit the UK. A surge of 1.215 metres was recorded at Lowestoft at 16:30 pm. The two images below for Tuesday 23rd January, give an indication of the storm conditions present. The first image shows the Shipping Forecast for the Thames area
and the UK Met Office Surface Pressure forecast for midnight on Wednesday 24th January.

The second image shows charts for Wind speed and direction the week of 20th-27th January 2024, recorded at Happisburgh, up the coast in Norfolk. One of the interesting aspects of the charts is the change in wind direction and drop in Wind speed, in the early hours of Tuesday 23rd January. Followed by a change in direction and increase in wind speed around midnight on the 23rd/24th January 2024.
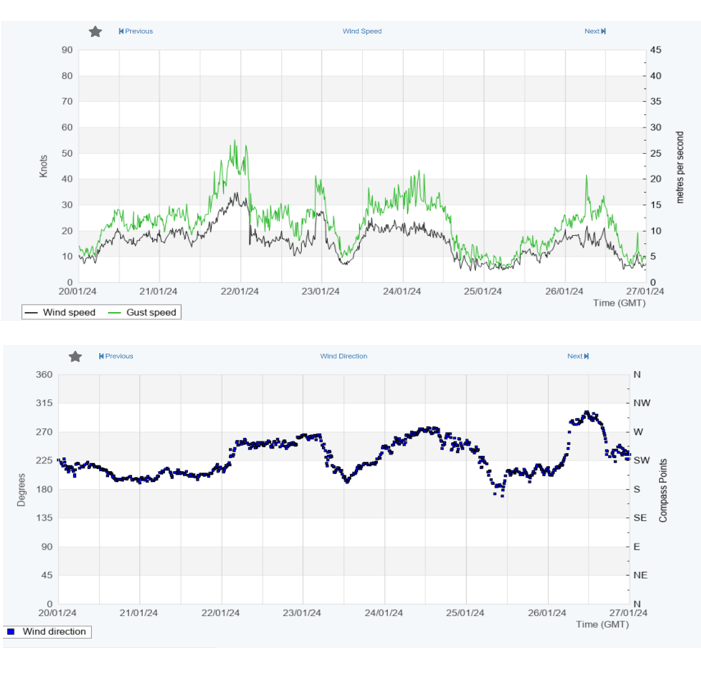
Perhaps related to this is the sizable negative surge and subsequent large return surge on January 24th 2024. It is thought that a negative surge and subsequent Peak surge can follow the trajectory of the centre of a storm over a coastline. A time lag is also said to exist between negative and positive surge levels in storm conditions. In a study of surges at Immingham between 1930 and 1938, it was found a time difference of around 18 hours appeared between the highest and lowest level of a surge. On Wednesday January 24th, the lowest observed sea level at Lowestoft was 0.157 metres at 2:30 am, and the height of the surge was recorded as 1.215 metres at 16:30 pm. A time period of 16 hours.
In conclusion, it could be said both surges suggest different examples of energy levels. On the 22nd January, it is the intense ferocity of conditions, that could have contributed to the surge of 1 metre. On Wednesday 24th January, it is the energy present in the system capable of generating a return peak storm surge of 1 m +, following a significant negative surge.
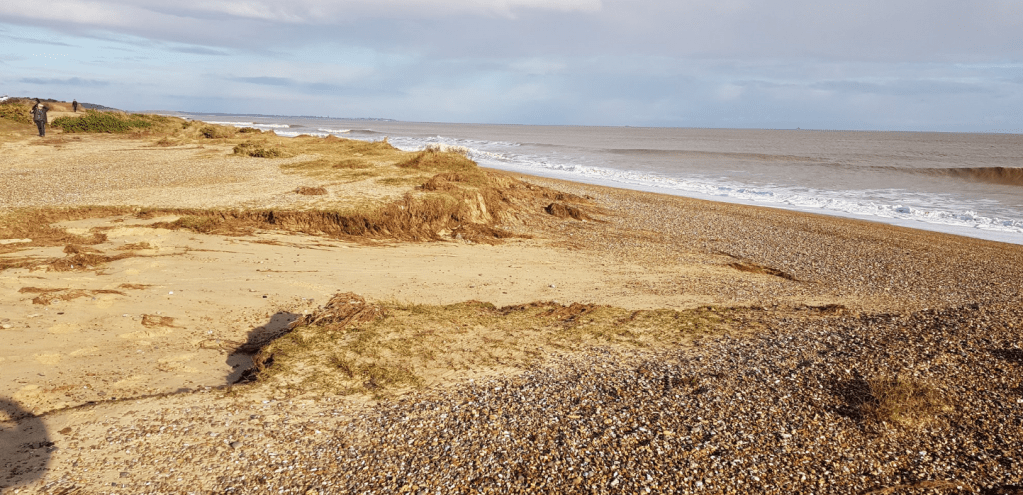
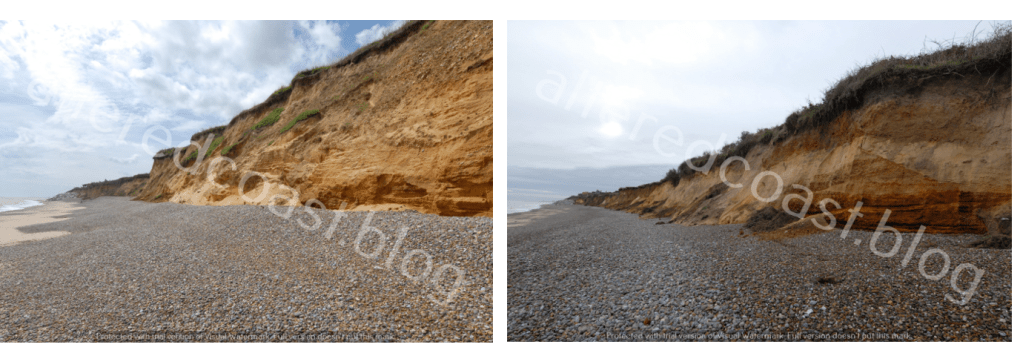
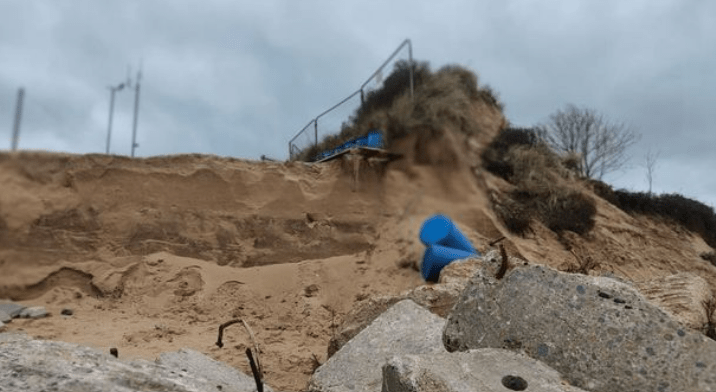
Even after the main Winter storm season subsided, intense local storms continue on the Suffolk coast. Future discussions will consider characteristics of the forceful dispute between meteorological and sea state conditions and the energy they produce. To assess how this altercation transmits to shift sediment and alter beach morphology on the coastline.