This discussion will travel down the east coast with the tides and surges of East Anglia and will consider how the features of the North Sea influence tidal patterns. Along the way, it will also consider the tendency of surges to occur around 3 to 5 hours before peak high tide.
The shape and position of the North Sea can be said to contribute to the tidal ranges on this coastline. At its northern end, the North Sea links to the North Atlantic through a large channel that passes by Scotland and Norway. At its southern end, the North Sea squeezes through a narrow strip to the English Channel. The tidal system is created predominantly by astronomical, semi-diurnal tides from the Atlantic. Semi-diurnal tides are those which see two high and two low tides of roughly equal size every lunar cycle. Tides rotate around centres, known as Amphidromic Points, and thanks must go to the Environment Agency in providing information about these points, of which there are three in the North Sea. The 1st Amphidromic Point is located in the Southern North Sea near the English-channel, the 2nd in the centre of the North Sea and the 3rd, close to the coast of Norway.
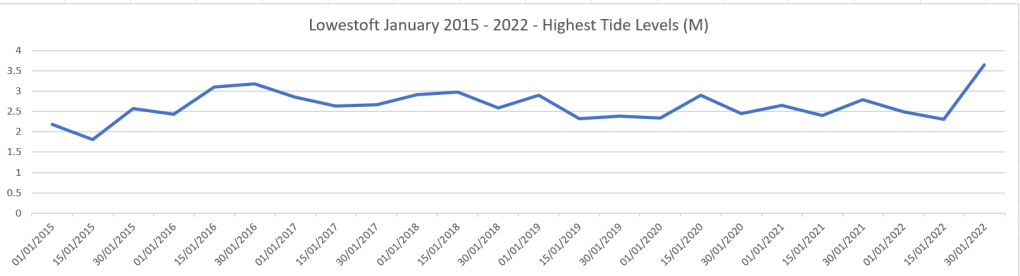
At the centre of Amphidromic Points, the sea is almost stationery with barely any tide. However, tides circulate round these points, as Kelvin waves in a counter-clockwise direction, southward down the coast of East Anglia, every 12 hours, 25 minutes. Each line of the Amphidromic Point represents 1 hour and 2 minutes of travel by a tidal wave, and the furthest from the centre of the Amphidromic Point, higher the tide. For example, at Immingham, placed further away from the centre of the Amphidromic Point in the centre of the North Sea average tide height is around 6-7 metres. Whereas at Lowestoft, located very near the Amphidromic Point in the southern North Sea, average tide height is around 2.5 metres.
The North Sea, is said to be a splendid sea for storm surges.
(Heaps, 1983).
The position of the North Sea attracts extratropical storms which pass from west to east with the capability to generate energy in the sea. A ‘Storm Surge’, can be formed by atmospheric level pressure acting on the surface of the sea, for example, a 1 millibar reduction in air pressure causes a 1 cm rise in sea level. Another contributory factor, is the effects of wind blowing over large areas of shallow water, with the depth of the southern North Sea said to be around 35 metres.
A‘ storm surge’ is therefore a transitory increase in sea level originating from a depression generated by a weather system. The shape of the North Sea influences this process, because when a surge travels down the coast in a southerly direction, it is accentuated by the concentration of storm energy water being driven through the narrow funnel into the English Channel.
A related concept is the extent to which surges occur a few hours before peak high tide. In a paper by K. J. Horsburgh and C. Wilson, data from 5 tidal gauges, spaced equally along the North Sea Coast at Aberdeen, North Shields, Immingham, Cromer and Sheerness, found the surge frequency to be around 3-5 hours before high tide. This assertion can be tested by looking at significant surges on the Suffolk coast, such as during the storm on 5th/6th December 2013 and the surges that accompanied high tides in January 2022.
Regarding the 2013 surge, it is interesting to note that with a large event like this, it could be problematic to focus on data from 5 specific sites, as you only know when a surge impacted these areas at a given time, whereas outside of these focus points data could show the surge at some locations arrived within between 2 hours or 30 minutes before High Water.
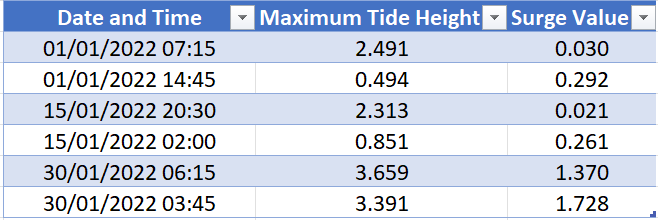
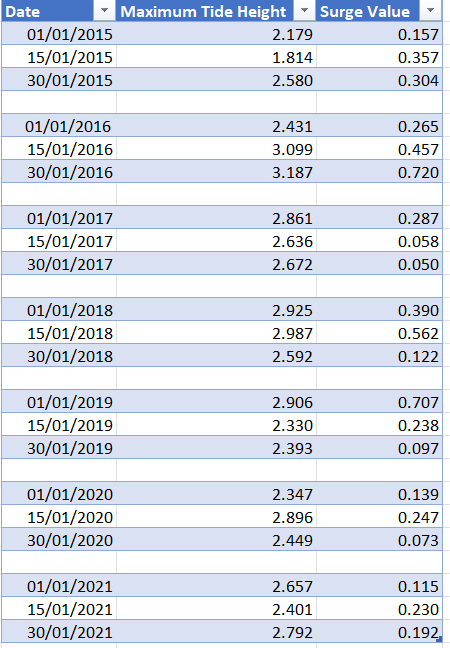
Figures in the table below show peak tide levels and maximum surge heights at Lowestoft for 5th and 6th December 2013 and the 6th December 2022.

Data obtained from the National Tidal and Sea Level Facility, provided by the British Oceanographic Data Centre and funded by the Environment Agency. The source is the Port, P024 at the site of Lowestoft, with the Latitude of 52.47300 and Longitude of 1.75083 with the start date of 05Dec2013-00.00.00 and end date of 23:45:00 for each date analysed. The Contributor was the National Oceanography Centre, Liverpool and data refers to Admiralty Chart Datum (ACD).
The table shows that peak high tide on 5th December 2013 was at 22:30, but the maximum surge height of 2.179 was recorded at 22:00, half an hour before peak high tide. Interestingly, on 6th December 2013, whilst the peak high tide of 4.228 was recorded at midnight, the maximum surge height of 1.856 metres was recorded at 03:15, over 3 hours after peak high tide. Elsewhere during the December 2013 surge, a report by Kenneth Pye Associates Ltd, commissioned by the Alde and Ore Association, gives figures from the Environment Agency tidal gauge at Orford Quay in the Alde Ore Estuary. On 6th December 2013, maximum high water was 3.06 m OD at 01:45 am around 71 minutes before predicted High Water and the surge was 1.66 m.
However, in relation to the high tides and surges of January 2022, figures roughly concur with K. J. Horsburgh and C. Wilson. On January 18th 2022, the surge of 1.2 metres, that travelled up the Alde Ore estuary arrived around 2 hours before normal spring high tide. Similarly, during the high tide and surge on 30th January 2022, peak high water was recorded at 06:15 in the morning with tide height of 3.659 and a surge height of 1.370 m, but the highest surge occurred 3 hours earlier at 03:45 am with a tide height of 3.391 and surge height of 1.728 m. All data is from the British Oceanographic Data.
Discussion of these figures of surges in December 2013 and in January 2022, should in no way detract from the in-depth, analytical work undertaken by K. J. Horsburgh and C. Wilson. Instead, it just serves to demonstrate how the processes of tides and surges are both fixed describable features and fluid dynamic elements. As our journey concludes with tides and surges of the North Sea, it has revealed the complexity of the everchanging forces that move the water in the ocean.