Winter Storms

Cliff frontage that looks like it has been sculpted by wave action with erosion notches visible, with sign warning of cliff falls. Pakefield 17th February 2024

This discussion will take an initial look at the extremely active winter storm season of 2023/2024. An enduring presence during the storms, Total Water Level (TWL) will be considered, alongside erosion common to both Sand and Shingle beaches in East Anglia.

Given the complex nature of the winter storms it might be simplistic to just identify one element, Total Water Level (TWL), when additional destabilising elements such as Wind Speed and atmospheric pressure also play a major role. But TWL can also play a major part, in agitated, elevated sea levels, extreme rainfall and extensive flooding of land and properties.

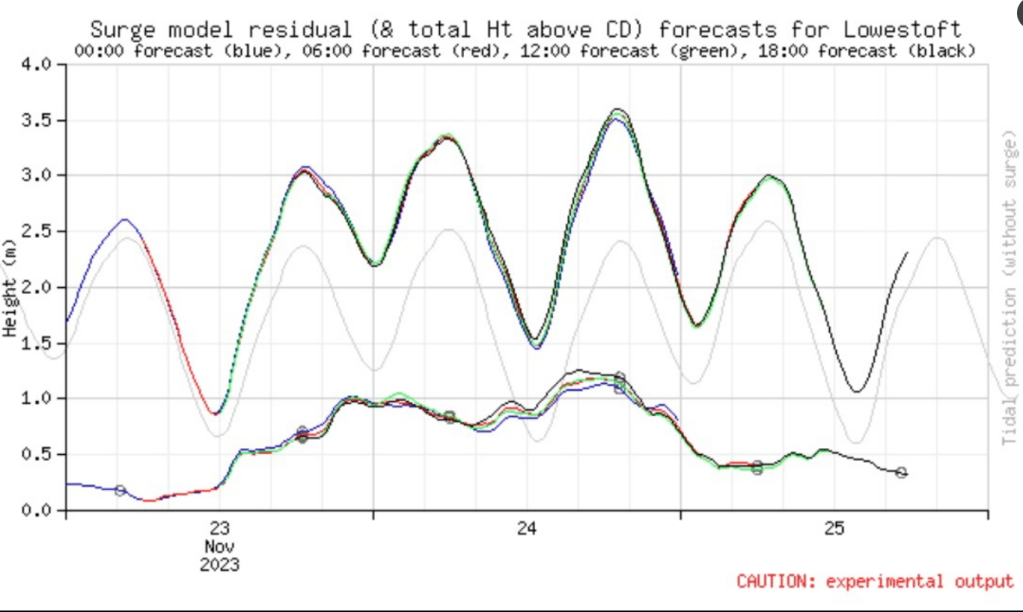
Winter Storms season of 2023 2024, begin with Storm Babet, the second named storm of 2023 on Friday 13th October, it continued through Monday 16th October until Friday 20th October. Storm Ciaran followed 9 days later on Sunday 29th and continued until November 4th. A considerable storm surge of over 1 metre occurred on Friday 24th November with a larger storm surge of just under 2 metres on Thursday 21st and Friday 22nd December 2023.

In 2024 on January 14th/15th, a Storm Surge measuring just under 1 metre hit the East Anglian coast. On 22nd January, Storm Isha and then Storm Jocelyn occurred in quick succession with 3 storm surges occurring in a week, the largest on Wednesday 24th January, measuring over 1 metre. On 30th January/February 1st, Storm Ingunn hit Norway, generating a Surge of over 1 metre. On Sunday 25th and Monday 26th February a storm, localised mainly in the Southern North Sea saw a 0.5 metre surge recorded for Lowestoft, with a surge of nearly a metre measured at Sheerness.  Finally, on the evening of February 29th/March 1st stormy conditions generated a surge of around 1 metre at Lowestoft.

Additionally, particularly High Spring Tides in March 2024, coupled with exceptionally high rainfall and strong winds, caused considerable erosion and flooding in places.

The list of storms above is a summary of a very intense period of activity. Therefore, this discussion will assess whether the TWL approach, can enable an assessment of the impact of storms on erosion of cliffs, dunes and beaches.

It is thought that in storms where TWL exceeds 3.9 m water levels can reach the dune or cliff toe, potentially causing hollowing of frontages and lowering of beach surfaces. Methods to assess TWL often use measures of Significant Wave Heights (SWH) that reach or exceed Storm Alert Thresholds. As it is thought that such thresholds, can initiate movement of beach material. The table below lists the SWH for Happisburgh, Lowestoft and Felixstowe for winter storm season 2023/2024.

Data sourced from https://coastalmonitoring.org/ The National Network of Regional Coastal Monitoring Programmes of England.

SWH heights hint at TWL at points on the coast where measures are taken, but they also give a picture of the variability of agitated sea states and how local they can be at times. For example, for November 24th, SWH of 3.6 metres is recorded for Happisburgh, above Storm Alert Threshold (STA), conditions that might contribute to the collapse of the road at nearby Hemsby. But SWH at Lowestoft remained below STA, close to where the road also collapsed at Pakefield.

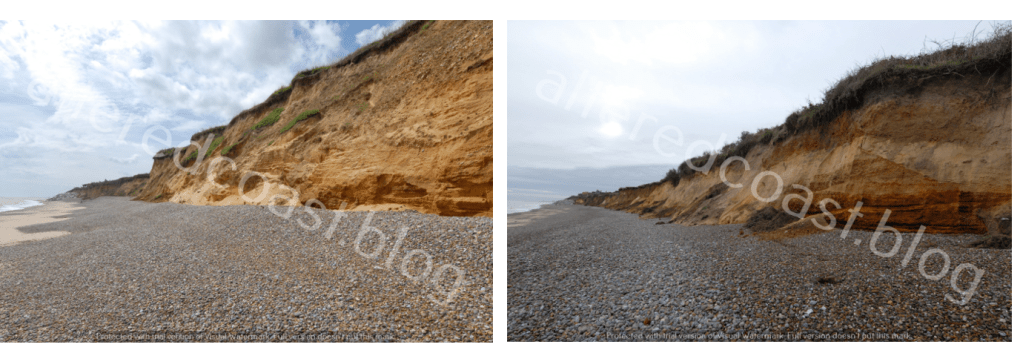
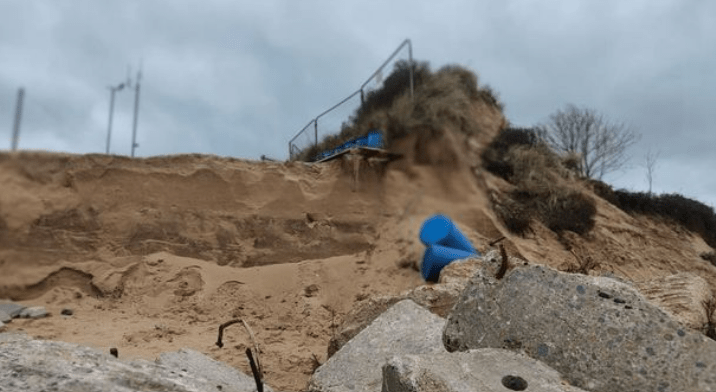
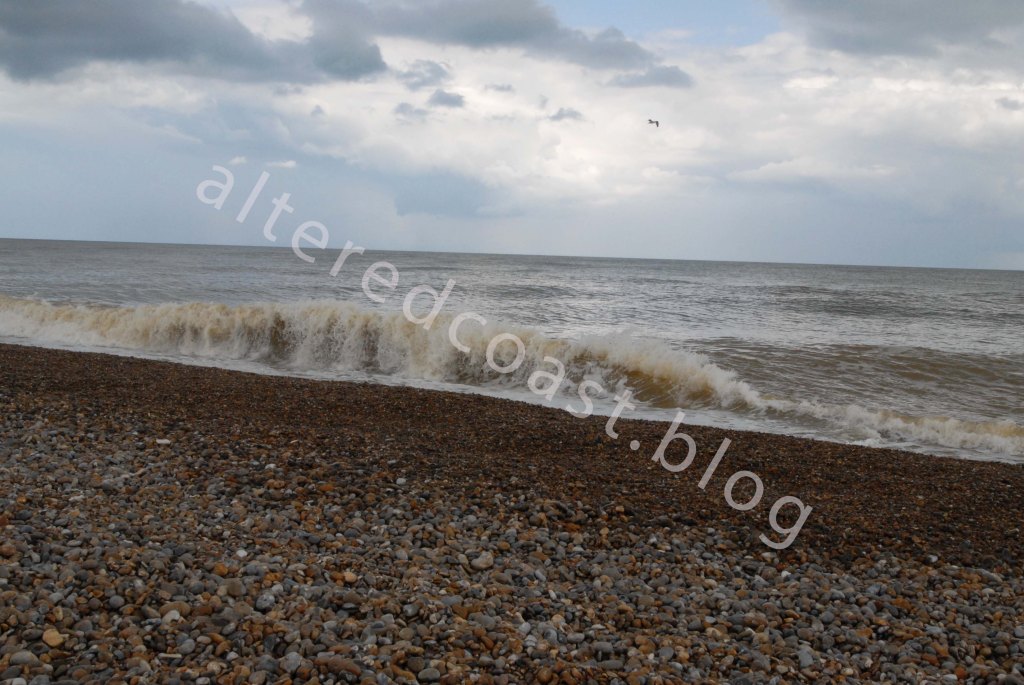
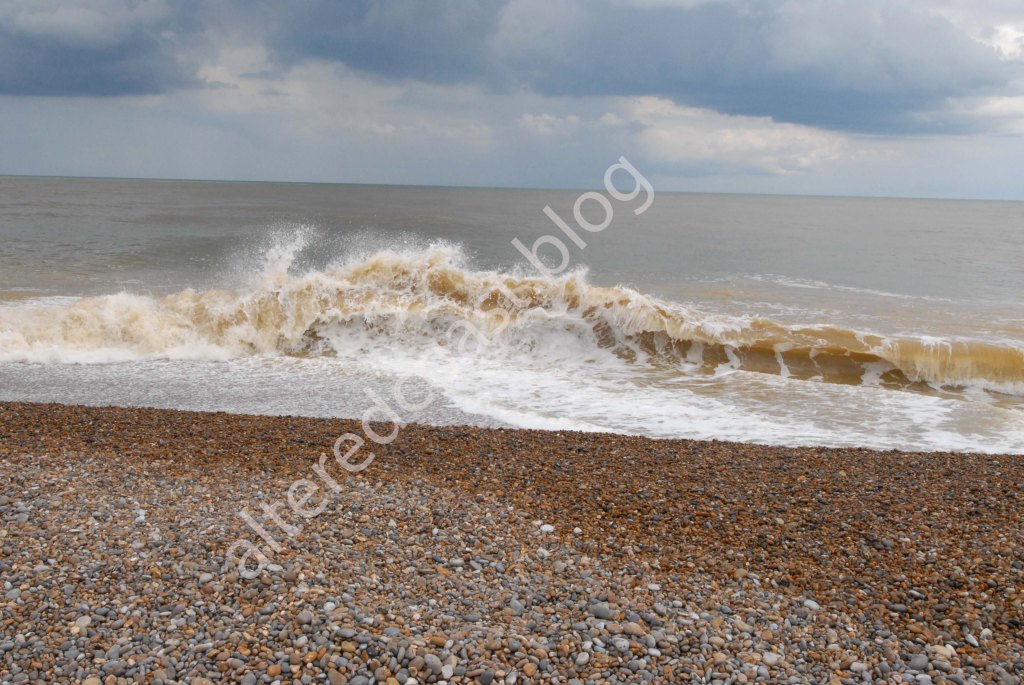
However, it is interesting to consider how common erosion features appear on beaches, despite the sections of coast being comprised of different layers of sediment. Photos taken on 20th January at Thorpeness and on 16th February at Pakefield, could be said to show wave height reached when dune face scouring occurred and could suggest the TWL present on the beach.

Photos taken at Thorpeness (L) on 20th January 2024 and (R) Pakefield on 17th February 2024.

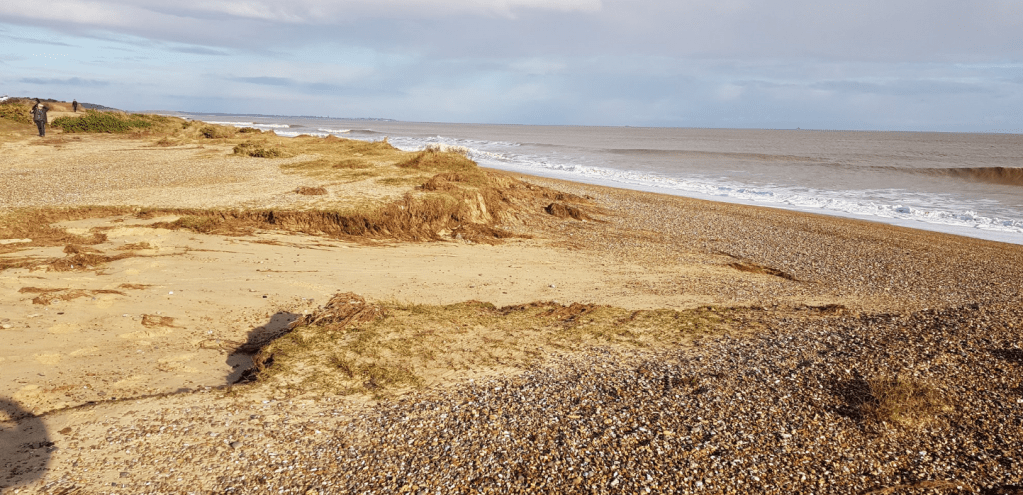
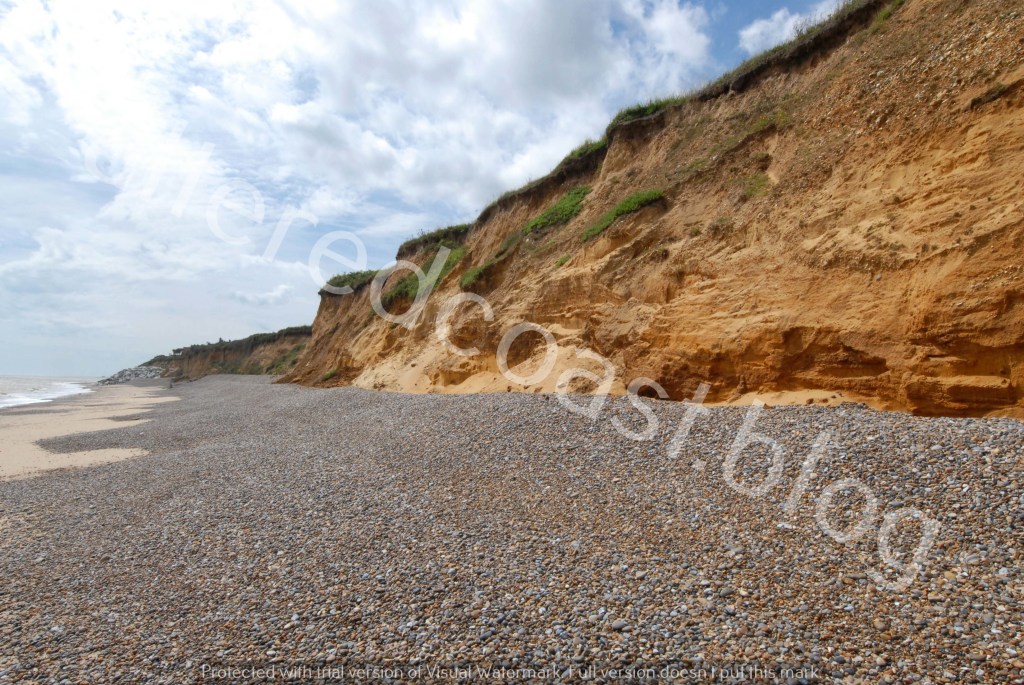
The potential energy in the TWL present on beaches is suggested in the photo below, taken at Minsmere that shows old wartime sea defences that have been uncovered on a beach stripped of shingle, with signs of a Scarp or cliff appearing to form in the remaining Shingle on the Upper Beach.

Old Wartime Defences uncovered on the beach at Minsmere, that has been stripped of shingle. Photo taken on 25th January 2024, courtesy of Steve Everett.

Cliff-like Scarps on Shingle beaches are said to only be maintained if physical conditions, enable sand to infill spaces in between the Shingle, to sustain the steep feature. Waves can cut into the bottom of Scarps, which can also influence subsequent wave direction. Increasing transportation of sediment off-shore.

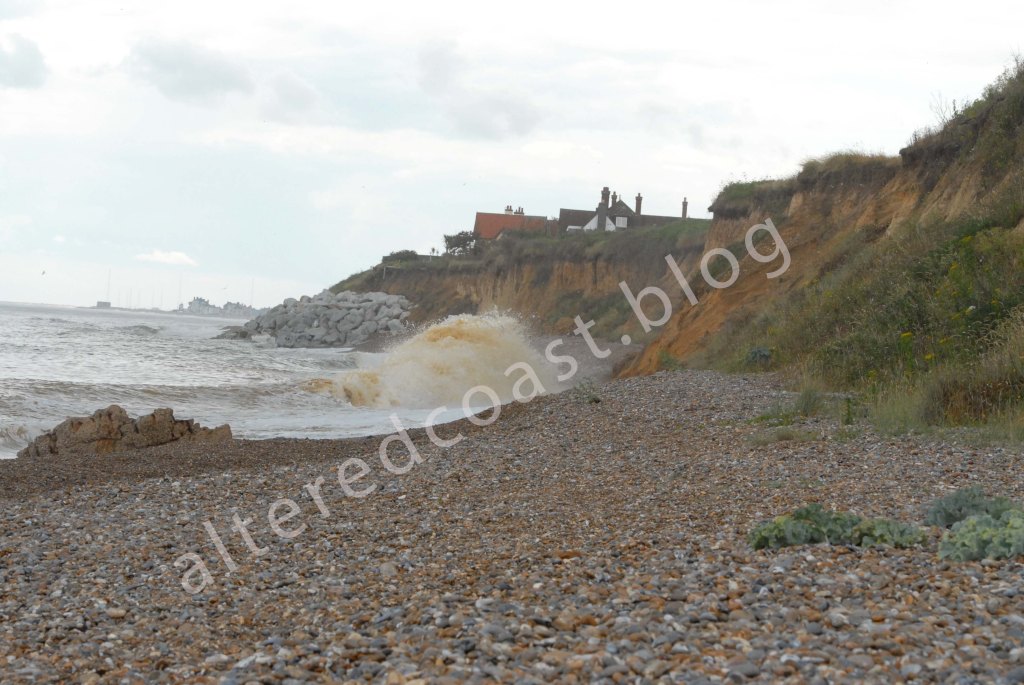
Another significant type of erosion that has occurred at several coastal locations in East Anglia is Cliff failure, due to rainfall. Instances of this erosion have been observed at Dunwich and Pakefield in Suffolk and Overstrand and Sidestrand in Norfolk. It has been found that in stormy weather it is the combination of TWL reaching the Cliff toe and high rainfall that can cause cliff collapse, but it is thought that heavy rainfall is the predominant cause of cliff collapse in East Anglia and other coastlines around Britain. Particularly as at Dunwich, it was said that foredune on the beach had accreted sediment, so waves were not hitting the toe of the cliff.

The two charts below from the Met Office show rainfall levels for January and February 2024.

Photos sourced from https://www.metoffice.gov.uk/

In January there were around 75-125 mm of rainfall and in February East Anglia had its wettest February on record, with 106.4 mm of rainfall.

Rainfall can cause severe damage to cliff structures in the following ways. Referred to as a Terrestrial process, rainfall can affect elements that determine the volatility of cliff materials. On the beaches of Thorpeness and Pakefield, with cliffs partly comprised of Glacial Till and sands, two views on the impact of rainfall on these surfaces are suggested.  

Photo of cliff erosion and rainfall runoff at Pakefield. Photo courtesy of Bev Hudson.

For Moderately cemented sands in cliffs that resist wave attack collapse can occur due to the penetration of rainfall soaking through materials. This process is aided by Desiccated Cracking causing sections of material to develop an imbalance that can lead to failure.

Signs of wave erosion with possible remains of a broken road as a sharp outline at the cliff top. Possible run-off of rainwater down the cliff frontage also visible Photo taken between Pakefield and Kessingland, courtesy of Bev Hudson on 10th March 2024.

For Weakly cemented sands, wave action succeeds at eroding the cliff base with erosion and instability progressing up though the dune structure. As material falls from the cliff surface due to wave action, volatility develops in the upper cliff and these combined weaknesses cause collapse.

At a British Geological site at Overstrand in Norfolk a 300m section of cliff was studied located roughly halfway between Overstrand and Trimlingham. In this location, rainfall is thought to be main driver in cliff retreat, due to the abundant presence of clay in cliff materials. In this context, rainfall is thought to have the following impact on cliffs in this area.

There is thought to be a greater likelihood of the formation of pathways across cliff sections without vegetation, with subsequent movement of sediment through the gullies. This could enhance the formation of mudslides which can transport sediment down the cliff frontage. The level of the water table within the cliff can also be elevated, causing water to percolate through the frontage. Water resistant layers of cliff material can also funnel groundwater through the cliff. Breakdown of lumps of sediment across these resistant layers is thought to be caused by the materials progression across the plane of these channels.

Regarding these failure processes, in addition to heavy intense rain fall, it is also thought the cumulative impact of moderate rainfall can build up weaknesses. Such frailties can cause landslides days or months after initial rainfall episode. This makes it very important that members of the public do not walk close to the edge of cliffs and dunes as coastlines may have not recovered from the effects of heavy rainfall. A sign on the Dunwich coast warns walkers that path is still closed following cliff collapse weeks earlier.

A sign on a footpath above cliffs that collapsed due to heavy rainfall in early January. Photo courtesy of Matt Salusbury/Dunwich Museum.

In this discussion, consideration has been given to the severe storms that have hit the East Anglian coast in Winter 2023/2024. With a consideration of whether the concept of Total Water Level (TWL) can act as a contributory factor to types of erosion that occurred. TWL can be measured in Significant Wave Height, which can potentially increase likelihood of wave contact with the dune or cliff face. With some erosion features displaying the level of wave height that hit the cliff. TWL is also present as a feature in cliff failure due to rainfall.

However, in considering the usefulness of TWL in assessing the effects of winter storms, TWL can suggest volumes of water likely to have been in contact with dune and cliff faces. But it could be said there needs to be an additional element present, to move, agitate and initiate water volumes. Therefore, it might be better to consider TWL as one factor amoungst several destabilising tensions within complex storm systems that can erode and weaken fragile coastlines.

Damage of The Surge

Damage caused to dune that used to separate Car Park from the beach. Hemsby 15th January 2024. Photo courtesy of Lee Jones.

A Storm Surge measuring just under 1 metre hit the East Anglian coast on the evening of 14th/15th January 2024 with the surge persisting for around 24 hours.

The Surge, which coincided with Spring Tides resulted in extremely High-Water levels causing flooding in places, with the Thames Barrier closing for the 211th time, since its inception. High Waves also caused severe damage at Hemsby and other locations. Therefore, this discussion will continue the 2nd part of a two-part look at whether Surges have a particular strength to cause serious damage. In this context, Damage is defined both as physical destruction as well as overtopping of structures and/or flooding.

The 1st part of this discussion looked at the damage caused by two surges in November and December 2023. The two surges had slightly different characteristics, the first on Friday 24th November was the lower of the two surges with high wind speeds and wave heights. It seems that this surge was also slow-moving with a longer duration and fetch, which is the surface area over which the wind blows over the ocean. The second Surge on 21st & 22nd of December was produced from much steeper pressure gradients with a deeper low-pressure system, but wave and wind heights were lower with a much shorter spike in the level and persistence of the surge.

It is generally accepted that determinants as to the magnitude of a surge include wind strength, direction, and distance over which the wind is blowing, the “fetch”. In addition to how these forces combine with atmospheric pressure, the track of a low-pressure system and how these influence the elevation and the velocity of the sea. But the level of a storm surge does not necessarily give an indication of the power of a surge. Surges are rarely similar, as they are produced from differing weather systems, and display different features. But is it the case that whatever their traits, Surges possess a particular strength to cause severe damage to coastal landscapes.

It is said the North Sea is particularly vulnerable to Storm Surges. One reason for this is the effect of Coriolis forces, which describe the way the earth rotates, which influence the acceleration of ocean currents. In the Northern Hemisphere this means movements of sea water are accelerated to the right. If a storm moves down the North Sea, elevated sea levels will be piled up against the coastline. This point is also relevant because the North Sea is rather shallow.

Therefore, it is thought that as two flowing elements connect with each other a transaction occurs between the quicker moving element and the slower element. If this process is translated to wind blowing over the ocean, a wind speed of 23 metres per second blowing over 200m of water, with a depth of 30 km, could cause a rise in sea level of 0.85m. If the gale force increases to 23 metres per second, sea level could increase to 1.60 m.

Shingle Ridge Sudbourne Beach. Suffolk 26th November 2023

The effects of Wind tension on the surface of the sea, produces differences in the speed of the current in relation to the depth of the water. It is thought that water is propelled at around 3% of the wind speed applied to the ocean’s surface. As an ocean current runs down a coastline, it rises progressively in a manner that operates inversely with the depth of water. Movement of the current and alterations in ocean levels can be magnified if the tension of the wind on the surface moves water in the direction the wind is blowing.

But do these surge characteristics provide evidence regarding the particular destructive power of surges. Especially as Wind Wave storms with Significant Wave Height persistently above Storm Alert Thresholds also occur in the North Sea. Such storms can also cause severe erosion features and harm to coastlines.

Additionally, it is said, sea water elevated by storms can simply mean tidal water is kept longer on beaches between tides. Specific forceful sea water episodes produced by storms that coincide with a tide, could simply be the product of a collection of storms, A series of storms can generate wave power equal to a single extreme weather event. Is it possible within these tempestuous sea states, to pick out a surge, as the sole culprit, of a culmination of damaging coastal events.

It is valid to query the usefulness of isolating one type of agitated, sea state that predominantly presents itself simply as the high wave heights or water levels that cause the damage. It could be more useful to coastal communities and urban centres affected to warn of higher than usual tide levels, with faster wind speeds and waves than normal. However, it isn’t the case that such a sea state will remain as a volatile phenomenon to be viewed from a distance.

With the surges in late 2023 and in the last few days, it is the large scale, almost clean sweep, for want of another description, of the destruction, that marks these surges as significant. At the time of the largest surge on 14th/15th January 2024, wind speeds at Happisburgh were under 30 metres a second. At Felixstowe, measures were just above 20 metres per second around about the time of the highest surge on Monday 15th January. Yet a Flood Warning was in place for Sunday 14th /Monday 15th January for flooding at Bawsdsey Quay and Felixstowe Ferry. With sea levels at mAODN (height above average sea level) of 2.92, which is 0.88m above tides tables.

Therefore, to conclude this debate, even though every storm surge can be different, generated, as they are, by numerous systems acting on the ocean’s surface. Each surge is a demonstration of the transfer of momentum between atmospheric systems and the sea. Alterations in pressure systems alter energies down though the surface of the sea which are felt at all levels. With wind tension applied to both the physical surface and as well as equidistant to it.

Thorpeness Beach. 26th November 2024.

The deepening of low-pressure, the strength of the wind and size of the area over which it blows, and the duration can initiate systems outside of normal tidal processes. These mechanisms can elevate and give Surges a particular force. When this is ranged against coastlines and tidal estuaries it can generate abnormally high-water levels. It is the intensity of these energy processes that can cause severe disruption to coastal landscapes and infrastructure.

Surge

Few areas are more susceptible to large dangerous storm surges than the southern part of the North Sea.

Storm surges, 1967–1982. N. S. Heaps. Geophysical Journal International, Volume 74, Issue 1, July 1983, Pages 331–376.

This discussion will begin a two-part consideration to look at storm surges. The first part will discuss the effects on the East Anglian coast of two surges that occurred on 24th November and December 21st/22nd 2023. The second part will debate the extent to which storm surges possess a particular strength with the ability to cause significant long-term damage on a coastline. This 2nd part will debate contributory factors to the potential power of surges, with reference to the slightly different meteorological conditions that produced the surges in November and December.

On Friday 24th November, a storm surge measuring over 1 metre was forecast for Lowestoft, with similar forecasts in place at Cromer and Felixstowe.

Data sourced from The National Tidal and Sea Level Facility
 (NTSLF) https://ntslf.org/storm-surges/surge-forecast

In the time period of the surge several significant erosion episodes were recorded. Particularly significant damage occurred at Hemsby in Norfolk and Pakefield in Suffolk, where large sections of access road used by residents at both locations, collapsed into the sea.

Image showing the section of Access Road that collapsed at Pakefield on Friday 24th November. Photo courtesy of HM Coastguard Lowestoft.

In other areas of Suffolk, At Minsmere RSPB nature reserve, the surge overtopped the dunes and temporarily washed into the nature reserve before draining out within 2 days. Sea water from the surge, flooded the beach fence line, with the sea seeming to break through sections of dunes in places.

Area of Dune where sea appears to have broken through a section of dune in front of RSPB Minsmere, following surge on Friday 24th November 2023. Photo courtesy of Steve Everett. RSPB.

At Thorpeness, the surge seemed to level the length of the cliff frontage, with a noticeable difference in beach profile from photos taken on November 5th and 26th November 2023.

Two photos taken at Thorpeness beach. Image on Left taken 5th November 2023 and image on the Right taken 26th November 2023

At Sudbourne beach, the shingle ridge appears to have further flattened out, with two wide fans of shingle that appear to stretch towards the water channel behind the wall that protects the Alde & Ore Estuary. In the estuary itself, the surge caused a greater volume of water than usual to flood the saltings for prolonged periods of time both before and after high tide.

Sudbourne Beach, near Aldeburgh, Suffolk. 26th November 2023

The second storm surge occurred as Storm Pia hit the UK. between midnight on Thursday 21st December and the early hours of Friday 22nd December 2023. A storm surge measuring around 1.7 metres was forecast for Lowestoft.

Data sourced from The National Tidal and Sea Level Facility
 (NTSLF) https://ntslf.org/storm-surges/surge-forecast

At Hemsby, damage from the surge included scouring of around 2 metres of sand from Hemsby Gap, and the formation of a 1-3 metres Scarp. Additionally, less than 2 metres of dune remains North of Hemsby Gap, with a car park and Hemsby Independent Lifeboat station, immediately behind this section of dune. The damage to the slipway has meant that Hemsby Independent Lifeboat has been out of service.

Photo showing 1-3 metre Scarp at Hemsby Gap. Image taken 24th December 2023, courtesy of Hemsby Beach Cafe

Another significant feature of the December storm surge was the tide locking effect that occurred on the Norfolk Broads. This meant water that would naturally drain out into the sea from the Broads was prevented from doing so because of the volume of water coming up the rivers from the storm surge in the North Sea.

Two images showing water levels at Beccles Quay on River Waveney on 22nd December and land potentially below sea level on the Norfolk Broads.

Two weather system maps for the storm surge on Friday 24th November and Thursday 21st December, provide a useful framework for the debate in part two of this discussion, as conditions show some similarities as well as significant differences.

On Friday 24th November, a low-pressure system was located off the East Anglian Coast, whilst a high-pressure system was located over the Atlantic. At Happisburgh low pressure dipped to 1016 mb between 10:50 and 15:20 on Friday 24th November. A Significant Wave Height of 3.6m was recorded at Happisburgh. 

Surface Pressure Forecast Map produced by the Met Office for midnight on Friday 24th November 2023. https://www.metoffice.gov.uk/weather/maps-and-charts/surface-pressure

On Thursday 21st December, again a low-pressure system was located off the East Anglian Coast, whilst high-pressure was located over the Atlantic. However, the pressure gradient was much steeper, with low-pressure deepening to 997 mb between 07:30 and 08:00 am on Thursday 21st December. SWH also remained below the Storm Alert Threshold on Thursday 21st and Friday 22nd December 2023.

Surface Pressure Forecast Map produced by the Met Office for 12:00 pm on Thursday 21st December 2023. https://www.metoffice.gov.uk/weather/maps-and-charts/surface-pressure

It would seem to be apparent that the two storm surges in November and December, were produced in slightly different weather conditions, but both surges had a significant effect on the coast and inland tidal estuaries. Therefore the 2nd part of this discussion will consider the potential specific strengths of a storm surge and debate this phenomenon with reference to meteorological conditions and likely sea state features that can make surges so damaging.

Mark of The Storm

Erosion of cliffs below North End Avenue, next to Rock Revetment Flood Defence. Thorpeness Beach 5th November 2023.

As storms continue to batter the East Anglian coast, this discussion will consider marks left by storms Babet & Ciaran on two beaches in Suffolk and ask how useful it is to examine erosion through the lens of the Palimpsest. The term refers to how a surface or feature, when something new is added, continues to display residues of what was there before.

Firstly, data for Significant Wave Height (SWH) at Lowestoft recorded the highest values to date for 2023 during Storm Babet and Storm Ciaran. The SWH Storm Alert Threshold for Lowestoft is 3.11 metres. During Storm Babet, SWH was slightly below this and for Storm Ciaran it was noticeably above it.

Data provided by https://coastalmonitoring.org/, The National Network of Regional Coastal Monitoring Programmes, funded in five-year cycles from DEFRA and administrated through the Environment Agency.

The Tpeak(s) or Dominant Wave Period, (DWP) is the period where the highest wave energy is centred. It is interesting that the DWP is the same for both wave heights. Particularly as the same DWP was also recorded for the highest SWH in 2022, during a storm on 31st March, when a SWH value of 4.10 metres was registered.

It is also worth noting that the highest value for Significant Wave Height was also recorded at Happisburgh, during Storm Babet on the 20th October. A SWH of 3 metres was registered, with a Dominant Wave Period of 6.2. The Storm Alert Threshold at Happisburgh is 2.74 metres.

Data for SWH has been considered because it enables an insight into the turbulence of the sea. It also provides the first noticeable signs of repetitions or noticeable exceptions. Patterns of wave behaviour that indicate continuity or require a new understanding, that learns from and develops, what has gone before. The first consideration of the usefulness of Palimpsest.

This term is discussed in a doctoral dissertation by Alison Stoneman, titled Holding The Line: contemporary poetry of British coastal change. PhD, Nottingham Trent University. Stoneman critically analyses Coastal Erosion poetry, and refers to storm damage on beaches, as sheets of features, that add to and alter marks left by storms before. Following storms Babet and Ciaran, erosion features of Thorpeness Beach and Sudbourne Beach in Suffolk were observed and will be considered through the lens of Palimpsest.

To start with Thorpeness, it might be quite straightforward to consider the framework of Palimpsest as a useful approach to analyse erosion at this location. As observations of erosion on the cliffs, show recent changes set in the context of the geology of the Pleistocene. Even though the beach changes quite dramatically, remnants of what has been laid down previously still show through. This is particularly relevant when considering the Pleistocene and the Palimpsest. As a couple of the poems analysed by Stoneman refer to Doggerland, a stretch of marshland that stretched between England and Europe, that was inundated by the sea at the end of the last ice age.

Observing current erosion through the lens of Palimpsest, is also useful as it enables a consideration of recent erosion and how this has affected the cliffs differently. Elevated wave action can scour the base and lower portion of cliff surfaces, stripping the surface and causing sediment to slump onto the beach.

At Thorpeness erosion of the cliff frontage, in the last 5 or 6 months has shifted further up the towards the Ness, at Thorpeness. The surface has been partially stripped of the vegetation and glacial til and fossilised remains and this has left bare sand which has been sculpted by wave action. However, the area of beach that has been spared recent erosion has been freshly eroded by Storms Babet and Ciaran. But because it had been stable for a few months prior to this, the glacial till/fossil sediment is still visible on the surface of the cliff and slumped sediment.

Cliffs showing different stages of erosion. Thorpeness Beach 5th November 2023

The next location, Sudbourne Beach provides a different setting in which to consider the Palimpsest. It is a high-energy shifting shingle beach, and in such a dynamic area, it is hard to identify threads of current and past coastal change. Recently, the ridge at the back of the beach has flattened with an extensive wide area of shingle showing signs of overtopping with shingle washed by waves into two tongues down to the marshes. The shingle fan stops short of the waterway behind the earthen flood defence that protects the River Alde.

Flattened shingle showing signs of overtopping by the North Sea to marshes behind a previously protective shingle ridge. Remnants of ridge are visible in immediate foreground of photo. 5th November 2023.

On Sudbourne Beach, it could be hard to see the accumulation of coastal features, intrinsically linked over time, it is only possible to see the effects of what Gillian Clarke’s poem, Cantre’r Gwaelod’, describes as the ‘indifferent hunger of the sea’. Whilst it is possible to see the remains of the Shingle Ridge as it was and the smaller shingle ridge that runs the length of the back of the beach, it would seem to be a coastal location that is very much ‘coming into being’. It would be difficult to identify landmarks that provide clues to the trajectory of the coastline.

Long view of remains of shingle ridge with Alde Ore estuary and North Sea. Sudbourne Beach. 5th November 2023.

But perhaps, such locations should be seen as wild places, seascapes governed by natural forces, especially at a time of storms of increasing severity. Use of the approach of the Palimpsest, could provide tools to look through the local, forceful, intense action of Wind-Wave Storms. According to Stoneman, each erosion feature is distinct, but through its characteristics, relates either by its location or by its form to earlier examples. Use of the Palimpsest as a vehicle to see through erosion and sea state to create methods to interpret future marks of the storm.

Winds & Waves of The Storm

Waves breaking at Hemsby Gap on the Norfolk coast, 17th September 2023.

Storm Ciaran hit the Southern half of England on the evening of Wednesday 1st November and further intensified to a severe storm on Thursday 2nd November.

One distinct feature of Storm Ciaran was that it seemed to be a Wind Wave Storm. A characteristic of a storm of this nature is the Significant Wave Height (SWH), the average height of a third of all waves. It is thought if SWH, reaches above a certain threshold, waves of this height have the potential to move significant amounts of beach material.

The SWH at Hemsby was forecast to be 2.4-3 metres, with wind speeds of 50/70 km/h, with a southerly/south-easterly direction. At Felixstowe SWH was forecast to be 2.4-3 m, with wind speeds of 65-75 km/h, with a southerly direction. At Lowestoft SWH was forecast to be 2.4-3 m, with wind speeds of 50-70 km/h, with a southerly direction. At Lowestoft the general, long-term SWH Storm Threshold measurement is 3.11 metres and at Felixstowe it is 1.94 metres.

The Met Office Surface Pressure Charts indicate the presence of weather conditions likely to produce disruptive sea states. The charts showed the Low-Pressure values for Storm Ciaran to be around 980 mb off the Southwest Coast at midnight on Thursday 2nd November, deepening to 972 mb at 12 pm on Thursday 2nd November. The Shipping Forecast produced by the Met Office gave the status as Low 100 miles west of FitzRoy 972 expected Humber 956 by midday tomorrow.

Low-Pressure systems have the potential to raise the sea level, potentially producing damaging storm surges, strongly influenced by the meteorological conditions at the time. A small surge was forecast for Lowestoft, with a surge of over 0.5 metres forecast at Cromer.

Another interesting feature of Storm Ciaran was that it was forecast to be a very slow-moving storm, likely to cause heavy periods of rain or strong winds to remain over Southern England, and the coasts of the South West, the English Channel and the North Sea for some time. Not to draw any parallels, but one of the features of the 1953 Storm was that it was extremely slow moving over the North Sea, which expanded the length of the wind area, increasing the surface capacity of the wind to produce damaging waves.

As in a storm of this magnitude, Wind, Waves, Rainfall and Sediment can dynamically interact to unleash intense damage on vulnerable, fragile coastlines.

In addition to concern about destruction, is the sudden sense of loss caused by erosion. The rapid destruction or diminution of landscapes, changed potentially forever by the wind & the waves.

The Ness at Thorpeness Beach. 5th July 2023

July Tide Data 2015-2023

This discussion will continue previous considerations looking at Tide data from Lowestoft for the months of January and July, from 2015 to the present day. The two months were selected to give a contrasting snapshot of tidal values in a winter and a summer month in the year. A chart is updated twice a year with data from the 1st, 15th and 30th of the month, to indicate the highest tide values for these dates in January and July, for each year being considered.

The highest Surge (or residual) value is also collected and displayed in a Table below. This relates to the tendency for an elevated bulge of water, generated by meteorological conditions and separate from the tide, to arrive a few hours either side of tidal high water.

To begin by looking at Tide data for July 2015-2023 for the dates 1st, 15th and 30th of the month. The chart below shows the Highest Tide Value for the dates mentioned.

This chart uses data from the National Tidal and Sea Level Facility, provided by the British Oceanographic Data Centre and funded by the Environment Agency. Data is obtained from Lowestoft, Port P024, Latitude: 52.47300, Longitude: 1.75083.

The chart shows fairly regular tide heights for the years and dates selected. With the most noticeable features being the slight dips in tide levels in 2016, 2020 and 2023, which seem to occur uniformly on the 15th of the month. However, it seems that there is nothing particularly significant about the 15th of the month, as the higher values for tide heights for 2018 and 2021, occurred on the 15th of July for both these years. It is noticeable that highest tide value occurred on 15 July 2021, in same year that saw exceptionally high tides for January 2021.

Additional data for surge values for 2023 on the dates mentioned above has been collected alongside tide heights for these dates, and this data includes the tide values above.

This Table uses data from the National Tidal and Sea Level Facility, provided by the British Oceanographic Data Centre and funded by the Environment Agency. Data is obtained from Lowestoft, Port P024, Latitude: 52.47300, Longitude: 1.75083.

Consideration of Tidal levels and surge are useful to provide a snapshot of noticeable trends over time. As the basic data collected can provide a backdrop to observations or events on the coast. Additionally, these considerations can help to identify any significant alterations in the patterns of the ever-changing, ever-restless North Sea.

Shape of a Beach

Erosion of Cliff Face. Thorpeness Beach 11th August 2023

Recent visits to Thorpeness have revealed new erosion features, possibly exacerbated by extreme high waves observed in early July 2023. However, rather than focus on features on the cliffs and beach, this discussion will consider the nearshore processes likely to influence the shape of a beach.

Cliffing erosion into Shingle . Thorpeness Beach 11th August 2023

A local feature known as the Sizewell-Dunwich Sandbank system (SDBs), will be used as a framework to analyse the complex shifting systems that shape and remake this coastline, as no feature remains stable for long. The SDBs are the most enduring feature, but historically they have changed position and size and continue to do so. This section of coastline is a dynamic, fluid environment, with its nearshore characteristics, still unclear beneath the waves. Therefore, this discussion will debate existing analysis of nearshore characteristics, alongside recent photos of erosion and high waves.

High Waves arriving at Thorpeness 5th July 2023

The first system to be considered concerns a model to assess the effects of sediment transport, tidal flows, and wave heights on the SDBs. Regarding sediment transport, Bedload, refers to how sediment is carried by water and bounces along the ocean floor. Suspended Load describes how sediment is picked up and retained within the flow of water. For both methods, it was found tidal flows cause a conjunction of sediment transport, on Sizewell Sandbank. With sediment flowing along the landward side of the sandbank in the tidal flood flow and deviating in a seaward direction to join sediment transported in the tidal ebb moving up from the south.

Along the coastline of Thorpeness, the tidal flood is thought to run in a southward direction, almost parallel to the coast. Tidal currents attain greatest velocity 5 hours before high water, at 0.67 m s-1 on spring tides and 0.31 m s-1 on neap tides. Tidal ebb flows run almost south to north attaining greatest velocities 1 hour after high water, 0.72 m s-1 on spring tides and 0.36 m s-1 on neap tides.

Given the propensity for sediment to travel northwards from Thorpeness, it is interesting to note higher velocities for the south to north ebb flow of the tide. This could be significant if a strong high tide, stirs up significant amounts of sediment on the beach. Particularly as sand from Thorpeness is thought to be transported to offshore sandbanks, whilst shingle is retained on the beach. This relates to beach profile, as larger wave heights can remove fine grain sediment lowering the beach level, whilst shingle is pushed in steep ridges to the upper beach. 

Beach showing the intertidal zone stripped of shingle while ridges are piled up in Supratidal Zone. Thorpeness Beach 11th August 2023

This moves the discussion onto systems of wave action. A study ran model scenarios for different wave heights arriving from a North Easterly direction to assess the impact on the Sizewell Sandbank. In most examples, sediment accumulated on top of the Bank, whereas erosion occurred on the southward side. But in instances involving the biggest waves, the top of the Sandbank also became subject to erosion.

However, on this unstable shifting coast, it is useful to bear in mind that sediment transport can also be heavily influenced by wave direction. Whilst it is thought Thorpeness stands out as an unusual example of Northerly sediment transport on a coastline dominated by Longshore southerly transport. It is also the case that Southerly waves usually result in Northern sediment transport, and Northerly waves usually result in sediment transport in a Southward direction. Wave direction can also be cyclical, with Southerly waves dominating in one season and Northerly in another.   

It has also been thought historically, that Thorpeness retains a layer of resistant Coraline Crag, which underlies the beach geology and stretches out from below North End Avenue towards the ‘Ness’. It is believed this has sustained the headland and the Sizewell Sandbank.

In relation to these points, a disturbed section of water that indicates the presence of Nearshore Sandbanks, can be seen near the location of the promontory of the Ness and Thorpeness Beach.

Line of disturbed water indicating sandbanks. Thorpeness beach. 3rd July 2023

However, a photo taken a few days later in July, shows High Waves, probably caused by a combination of the Supermoon and Storm Poly, with the waves originating from a North Easterly direction. However, it is not possible to identify the line of disturbed water indicating the presence of the sandbanks.

High Waves arriving at Thorpeness Beach. 5th July 2023

But studies have found nearshore sandbanks at Thorpeness can attenuate (lessen) wave energy from NE waves. A study on Wave Refraction also outlines the importance of the sandbanks in reducing wave energy.

Whether the resistant layer of Coraline Crag is still holding firm, recent photos of erosion of the backshore seem to show exposed layers of darker rusty, red lumps of sediment pulled from the cliffs alongside Scarp erosion into the base.

Scarp erosion into cliff face and darker lumps of maybe Norwich or Red Crag exposed. Thorpeness Beach. 11th August 2023

Additionally, recent erosion at Thorpeness, seen in the photo at the top of this discussion, shows erosion seeming at times to shift south to north along the cliff line. With waves arriving at different points on the beach compared to previously.

High Waves on Thorpeness Beach 5th July 2023

There are many contributory factors that can influence erosion features and patterns of wave energy arriving at a beach. A model to assess sediment transport, tides and waves, identified an area of increased Bed Stress in the nearshore at Thorpeness beach. With sections also apparent on the eastern and southern areas of the Sizewell Bank.

Bed Stress refers to abrasion applied by running water on the Seabed. Additionally, Bed shear-stress is created by a combination of waves and currents, that contain disorderly boundary layers that intermingle in a manner in which one element does not automatically follow another. With the water motion described as forceful for beds consisting of sand and gravel. It is also thought the ability of the subtidal platform in the nearshore at Thorpeness to reduce wave energy is lessened and sediment fluidity increases at this location.

Thorpeness sits on an extremely active coastline. With rapidly changing nearshore processes with its bathymetry (profile), interacting with tides and waves to shift and erode sediment. In a high-energy system which can be made more forceful by the powerful influence of weather systems. In a destructive forceful interplay, that leaves its mark, and can forever alter the shape of a beach.

High Waves arriving at Thorpeness Beach. 5th July 2023

Sandbanks, Tides, Erosion

Hemsby Beach, looking from Hemsby Gap towards Winterton Ness. Photo Courtesy of Hemsby Beach Cafe

This discussion continues to look at severe erosion at the coastal community of Hemsby in Norfolk. Previous discussions considered Scarps and the effects of Lowering and Steepening on a Beach profile when the Sea Comes In. This latest discussion will consider how the tides, sandbanks and beach interact in a mobile, fluid environment on a fragile coastline.

The coast as a living feature, will also be explored using a process called Transgression. A mechanism whereby a coastline to compensate for an increase in sea levels due to beach lowering and reduction in width, reclaims land space by eroding into sand dunes to attain a new breadth and elevation.

The mechanism of Transgression is described in a report prepared in 2018 for Great Yarmouth Council, entitled Hemsby Coastal Management Report. It discussed possible solutions to erosion at Hemsby, following severe storms after the Beast from The East in 2018. The map below gives a rough indication of the location of the Sand Banks in this discussion. Although the paper from which it was sourced was written in 2007.

Map showing Great Yarmouth Sandbank System, sourced from Morphodynamic behaviour of a nearshore sandbank system: The Great Yarmouth Sandbanks, U.K.
lJosé M. Horrillo-Caraballo; Dominic E. Reeve

Key assertions in the report suggest a relationship between a feature known as Winterton Ness, and the area south of Hemsby Gap. With particular focus on the Caister Shoal Sand Bank which follows the line of the coast from Winterton down to California. Although the exact nature of the relationship is unclear, the presence of a deep-water near shore channel that runs between the Caister Shoal Sand Bank and the shoreline suggests a tidal flow pathway.

Particularly regarding alterations, leading up to 2011, when a swift sizable build-up of sand was observed on the sea ward side of the near-shore sand bank. This accumulation shrunk the cross-sectional area of the sandbank, causing it to move closer towards shoreline, reducing the width of near shore channel. The land facing side of Sand Bank is also the sea-facing side of the shoreline at Hemsby. Restriction in the width of near shore channel, led to cutting into the landward side of the Sand Bank, which focused higher tidal flows of deeper water further towards the shoreline.

This process restricted the area available for beach recovery, as increased erosion, caused beach retreat. To reclaim this restriction in space, the sea eroded into the dune system, to regain space to enable a more natural beach to develop at a higher level.

An abnormal tidal environment is also said to exist between Winterton to Caister. Normal Flood Tide flows North to South, and Ebb South to North. This creates a sizeable difference in tidal elevation and current speeds in both directions, forming a ‘Head’ of water between Winterton and Caister.

Map from the Hemsby Coastal Management report showing the Normal Flood and Ebb Tides in the North Sea and the flows round the Great Yarmouth Sand Banks.

Regarding the tidal regime between Winterton and Caister, average tidal current velocities are thought to reach a maximum around 4 hours before High Tide at 1.75 m/s on Spring Tides and 0.98 m/s on Neap Tides. Regarding the Ebb Flow, average velocities reach a maximum 2 hours after High Tide, 1.45 m/s on Spring Tides, 0.82 m/s on Neap Tides.

Residents from Hemsby have observed that a Sandbank can be seen 50 yards out from the shore, this pinches the flow of tide which accelerates to this point. A recent video taken by Hemsby Beach Café, could indicate the location of a near shore channel on Hemsby Beach.

It has also been observed that it doesn’t take much to cause damage, an easterly wind, a reasonably high tide along with low pressure lifting up the sea. Recently on 11th June 2023, a notice from Great Yarmouth Council warned of metal and concrete debris exposed on Hemsby Beach, in front of the Gap area, currently protected by large boulder blocks. This followed High Tide which covered the beach area at Hemsby Gap. In addition, only one line of dunes remains on The Marrams, with around 300 metres of sand estimated to have been lost since 2013.

One interesting point concerns the extent of erosion over time and whether a marked increase occurred prior to 2011. The time a noticeable accumulation of sand was observed on the seaward side of the Sand Bank. Residents assert that due to extreme winds early in the 1990’s, 12 foot of sand was stripped from the beach, and it hasn’t recovered since. It would be interesting to consider why sand lost in the 1990’s was not restored and retained on Hemsby beach.

Hemsby residents often say that they didn’t think a storm would be as bad as it turned out to be. This discussion considered living features on the coast, which could exacerbate the damaging effects of a storm. Regarding solutions, the report favours installation of a Rock Berm, planning permission has been granted, but funding is still to be sought. Nevertheless, a solution would seem to be needed. To enable both the living coast and the community with its life on the Marrams to coexist in this dynamic, living, breathing sea scape location.

When The Sea Comes in

Scarp cut into sand behind rocks at Hemsby Gap after storm on 20th April 2023

The precarious position of homes on the Marrams in Hemsby has been highlighted in a BBC documentary Life on The Edge. The vulnerability of the community on this coastline was exposed again when a storm on 20th of April saw waves cut into the sand behind rocks newly placed to try and stem the erosion. On the night of 20th April, waves were observed at 3 m high, with a lot of damage done before the peak of high tide. The BBC reported that around 4 metres of the sand ramp intended for use by Hemsby Independent Lifeboat was washed away.

The Scarp created was around 10 ft, but this erosion event was simply the latest in a series of severe episodes in the 10 years since 2013, when 20 ft waves scoured a considerable amount of beach and dune material with the loss of seven properties on the Marrams. In fact, in the BBC documentary, Life On The Edge, retired fisherman from Hemsby, Kenny Chaney says that the combined effect of two hurricanes in 1991 and 1993, lowered the beach surface by 12 ft, and the beach has never recovered. Therefore, this discussion will consider the likelihood of increased erosion on beaches considerably lowered by years of wave action.

Three photos taken in 1993, 2013 and 2023 show how much of the beach at Hemsby Gap has been eroded. In 1993 a large sandy beach is shown, with the shoreline around 40 metres from Hemsby Gap. In a photo taken in 2013, it is clear how much sand was scoured from the beach, interestingly a ‘cliff’ or Scarp also appears to be starting to form across the Gap. The final photo in 2023 shows Hemsby Gap after the erosion in February 2023 with the 10 ft Scarp across the Gap. Photos credit of Great Yarmouth Mercury and photographer Mike Page.

To consider the effect of sustained attrition by wave action, the discussion, will consider two points. Firstly, how the profile of the beach has changed, and once waves frequently cover a beach how waves interact with beach structures and the toe of the dunes, contributing to severe erosion.

To begin, it might be useful to consider two metaphors. Firstly, imagine a beach like the tread on a tank rolling over itself in a landward direction. Destructive high-energy waves reach further up the beach, scouring sediment from the dunes. Sand is scoured offshore, causing the cliffs to retreat, removing sand from the beach. This steepens and lowers the beach surface, leading wave action to drag more sediment from the beach, driving the dunes ever landward as cliff retreat increases.

Secondly, beaches with damp sand, are more likely to experience erosion. As sand that is wet, perhaps because lowering of the beach surface means it is covered in sea water most of the time, will not drift and accrete onto the dunes. Fine, dry sand is better able to drift and blow onto dunes, resulting in accretion, of the dunes and beach surface.

It is thought there is a link between beach condition and erosion. Once the Beach Wedge Area, (an interpretation for its width and thickness) reaches 10 m2 per metre of beach length, resistance to further erosion is much reduced. A survey of the beach profile of Hemsby undertaken as part of Anglian Coastal Monitoring by the Environment Agency from 2012 up to 2016, found areas experiencing continuous erosion with others some accretion.

Sections of the beach are separated into individual transects. In the transect next to Hemsby Gap, Profile: HW413, the graph shows Elevation Change derived from LIDAR data, (a method of remote sensing) acquired in the period November 2012 to October 2016. Data in the information below, is taken from November 2012 – November 2015. The graph shows Elevation and Chainage, the distance in metres, from the chosen landward starting point of the profile being measured, to the most seaward point on a beach, with both points remain stationary and fixed over time. Chainage Point 0, is the most landward point. In November 2012 and November 2015, at Hemsby Beach profile HW413, at Chainage Point 0, elevation was just under 7 metres. In November 2012, Chainage at most seaward point, was just over 145 metres, Elevation at 0. metres. In November 2015, Chainage at seaward point was 140 metres, elevation around -1.6 metres.

The survey concludes the north section of Hemsby beach showed signs of persistent erosion in the foreshore, and like other areas of the beach, there was a clear movement of the dunes in a landward direction. Data showed a build-up of sediment in the south at Hemsby beach and at Transect HW430, in November 2012 and November 2015, at Chainage point 0, the most landward point, elevation was around 14 metres. In November 2012, at the seaward point, Chainage was around 130 metres, with elevation at 0 metres. In November 2015, Chainage at the seaward point, was around 140 metres, with Elevation at 0.4 metres.

Storms in 2018, 2021 and 2022 each saw 20 ft of sand dune washed away, with drops or Scarps cut into the ramp used by Hemsby Lifeboat. This moves the discussion onto once waves frequently cover a beach, how they interact with beach structures, and dunes contributing to severe erosion.

Hard Structures on a beach can cause what is known as wave reflection, spray is driven upwards, as the force of the wave meets a solid element. It is said roughly an equal amount of energy is also driven down into the surface of the beach. This force can scour sand from the surface and causing the beach level to lower, revealing more of the hard defence to salt water. Over time this can reduce the width of the beach. It could also be useful to consider a process in which waves can be reflected offshore by sandbanks, clashing with the crest or trough of a wave, driving turbulence and increasing damaging sediment transport.

In a video of the storm on the 10th March in 2023 at Hemsby, wavesappear to clash with spray driven upwards, as they reach the base of the dunes. Equally, on 20th April 2023, when waves hit rocks installed to try and protect Hemsby Gap, spray from the waves, surged upwards, and arguably this force transmitted through the rocks, causing sea water to scour into the sand behind the rocks.

This discussion has considered the effect of successive periods of high-energy waves, over a number of years, progressively lowering a beach profile, scouring sediment and driving the dune ever landward. Once the sea comes in, its erosive properties strip away the surface and essence of the beach. Placing in jeopardy shoreline, dunes and communities on this vulnerable stretch of coastline.  

Scarps

Image of 10 ft Scarp created on Hemsby Beach on 25th February 2023. Photo taken on 10th March, credit to Hemsby Beach Cafe

Coastal Erosion features known as Scarps, are defined as almost vertical sea-facing walls, cut into sandy beaches or cliffs. Examples of Scarps have been seen recently at Hemsby Gap, where a 10 ft drop was cut into the beach and at Crantock Beach in Cornwall, where a 20 ft drop has been cut into the cliff.

Scarp creation can be described as the sudden action of high-energy waves scouring into sand. Contributory factors to this powerful action, describe an interplay between waves, sediment, and beach morphology, (the shape of the beach).

Regarding hydrodynamic (wave) processes, on the night the Scarp was created at Hemsby Gap, a high tide of 3.322 metres, with a surge residual of 0.619 metres was recorded at nearby Lowestoft at 12:30 am on the 25th of February 2023. Data originates from the National Tidal and Sea Level Facility, provided by the British Oceanographic Data Centre and funded by the Environment Agency.

Image of High Seas at Hemsby Gap, photo taken on 10th March, credit to Hemsby Beach Cafe

Considering sea state in perhaps an elevated, agitated form, it is thought that, not surprisingly, Destructive Waves possess the greatest ability to cause coastal erosion, as they possess a stronger Backwash, (the movement of waves back down to the sea). A process called Wave runup is described as the extra height a breaking wave achieves as it travels up the shore before resistance with the beach surface and the effect of gravity reduce its power. It is thought the height of a sand berm, influences the peak of a Scarp, whilst the raised toe of the Scarp is determined by the height of maximum Wave runup.

The Face and the Toe of the Scarp created on Hemsby Beach on 25th February 2023. Photo credit Hemsby Beach Cafe.

In a Collison Regime, Wave Runup strikes the face and the toe of the dune and cuts into the sand, shifting sediment out to sea, forming a Scarp.

There is some debate about whether summer waves cause Scarps and winter waves destroy them, as their height and energy tend to overtop and inundate sandy berms. Other views state higher winter waves usually cut back Californian beaches with significant amounts of sand removed from beaches.

Sediment and wave type, combine to influence beach shape in the following ways. Scarps are more likely to form on steeply sloping beaches, as it is thought forceful wave systems tend to produce beaches with uniform sediment sizes, with the predominant type being larger sediments. Sediment size also relates to beach slope, with a steep profile enabling larger sediment sizes to be flung further up the beach by higher waves.

On beaches with steep slopes, waves are better able to reach the edge of a dune or berm increasing the ability of aggressive wave action to cut into the beach. The Backwash of a wave also retreats down a beach with stronger force on steep sloping beaches. As wave action strips sediment from a beach, its lower section is reduced in height, as the top section of beach keeps its original level.

This discussion looked at Scarps, the creation in dynamic storm situations of near-vertical cuts in sandy beaches, cliffs or dunes, that can reach 10-20 ft in size. As a coastal erosion feature on a beach, Scarps can pose a serious hazard, and can take years to disappear. However, in the case of Hemsby, installation of flood defence mechanisms has corrected the destructive formation of the 10 ft Scarp. It will be useful to observe as the rock revetment settles to become part of the beach, and takes its place in the high-energy, tide and surge environment of the North Sea.