Hemsby

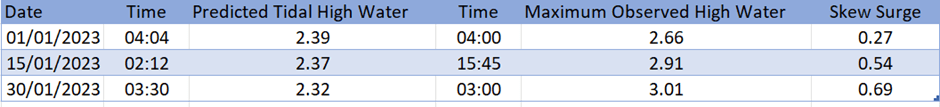
A recent discussion on alteredmarshes looked at a Skew Surge, the total difference between Maximum Predicted Tide Height and Maximum Observed High Water. It suggested the measure could aid storm analysis by suggesting specific conditions capable of generating a surge. However, information, such as the depth and size of a low-pressure system, whether the sea surface was still or agitated, wind speed and direction are needed to determine if a Skew surge, indicates the likely presence of severe storm.

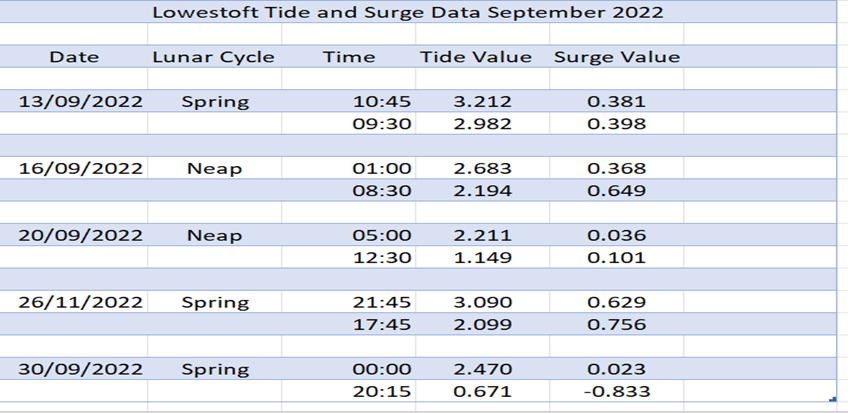
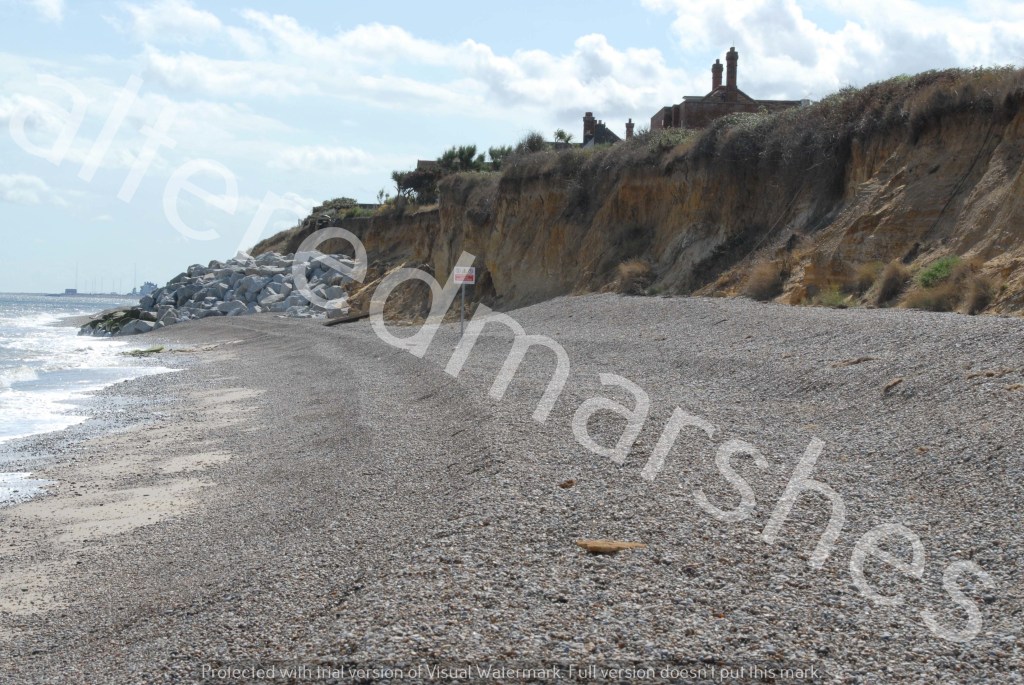
This assertion was put to the test, on Friday 10th of March, when a low-pressure system stacked against the Suffolk and Norfolk Coastlines in the Southern North Sea, generated a storm surge that severely damaged a coastal resort called Hemsby near Great Yarmouth. A surge measure of nearly a metre in size was estimated at Lowestoft, down the coast and predicted tide heights at Hemsby were 2.9 metres and 3.4 metres.

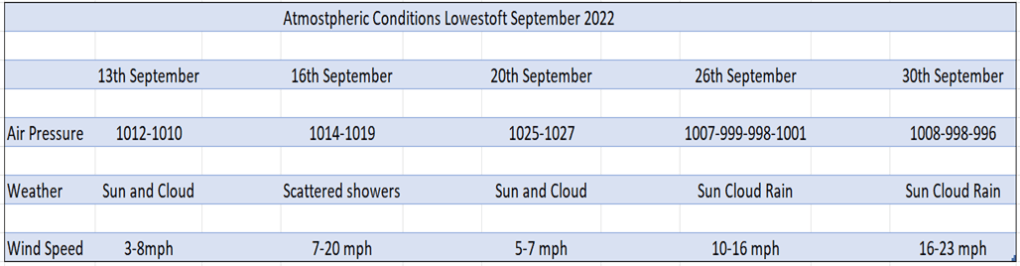
But to consider the significance of the storm surge on 10th March, it is useful to consider the likely presence of storm conditions around the time of the surge. Firstly, a low-pressure system, initially with tightly packed iso bars over Ireland, with low pressure values of 996-992 at 00:00 hours on Friday March 10th, was forecast to be situated over the North Sea and the Netherlands by 12:00 pm on Friday 10th March. Pressure systems can influence sea levels, with High Pressure causing a decrease in sea level and Low Pressure causing an increase. . It is said, a 1mb decrease in Low pressure can cause an increase in sea level of around 1cm. 

Low-Pressure System located over Ireland at 00:00 hours on Friday 10th March, source Met Office.
Low-Pressure System located over The Netherlands and the North Sea at 12:00 pm on Friday 10th March, source Met Office.

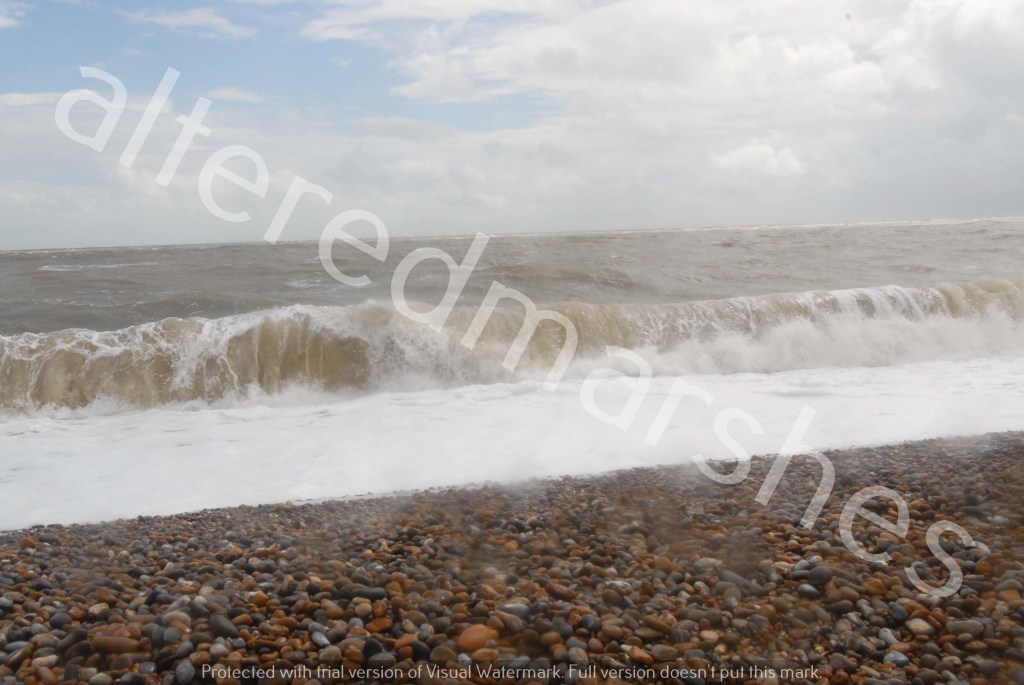
Elevated, agitated sea levels can be sustained for extended period, due the effects of strong wind speeds transmitting energy to the sea surface making it taut and choppy. The larger the expanse of ocean subject to the wind, the higher the waves, their power amplified by the fetch – the expanse of the area of the ocean exposed to the wind. Wind speeds originating from the Northeast were recorded to be around 50 mph and Significant Wave Heights at Lowestoft were recorded as reaching 3:4 metres at times on 10th March.

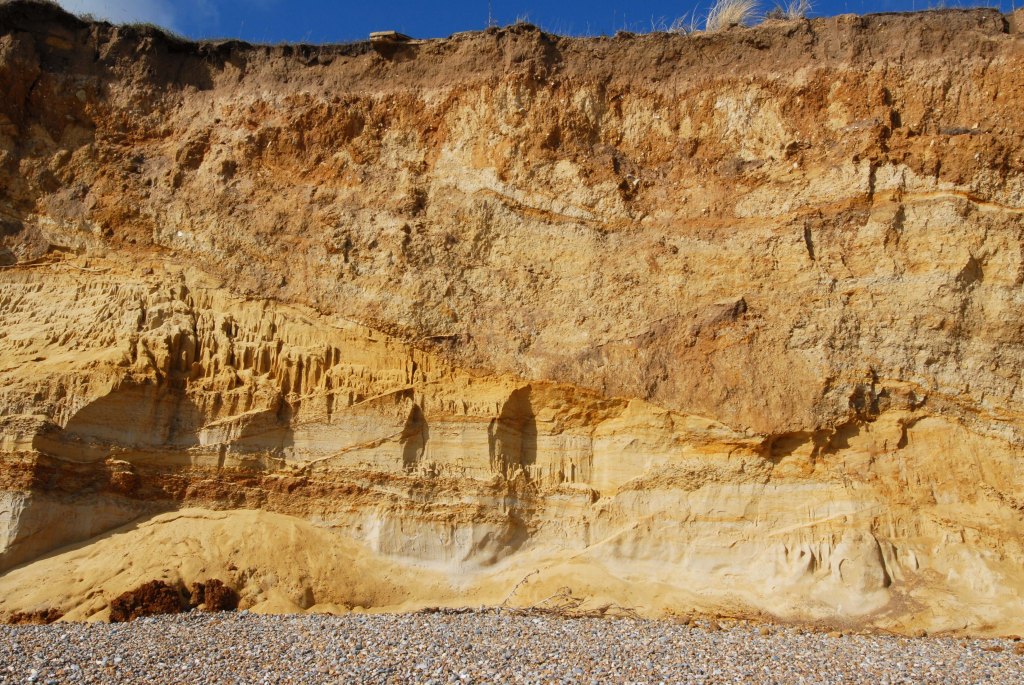
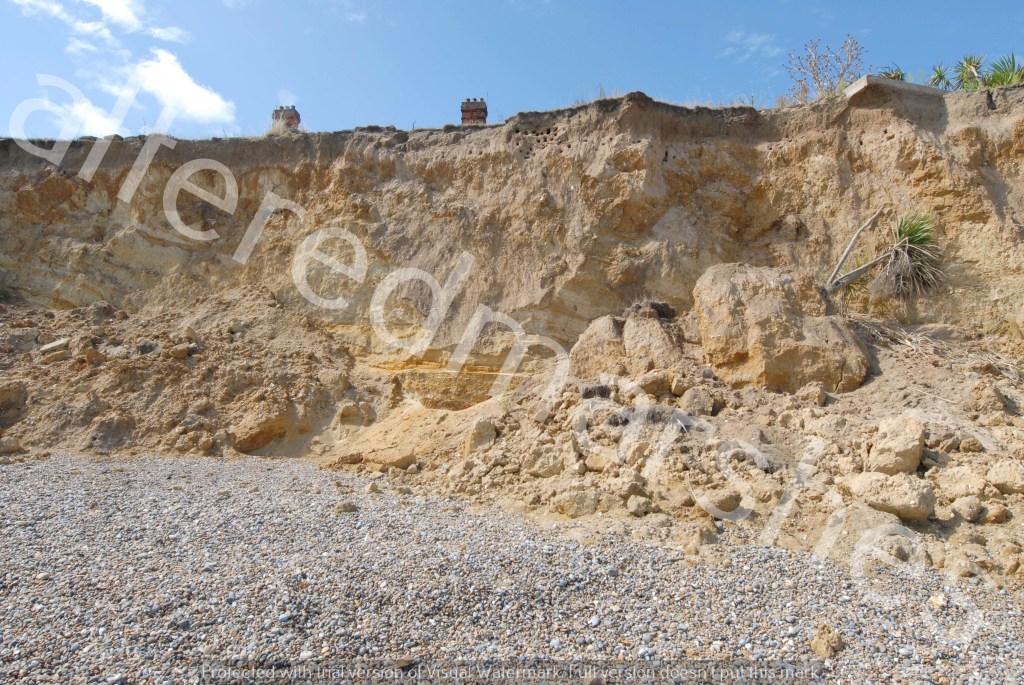
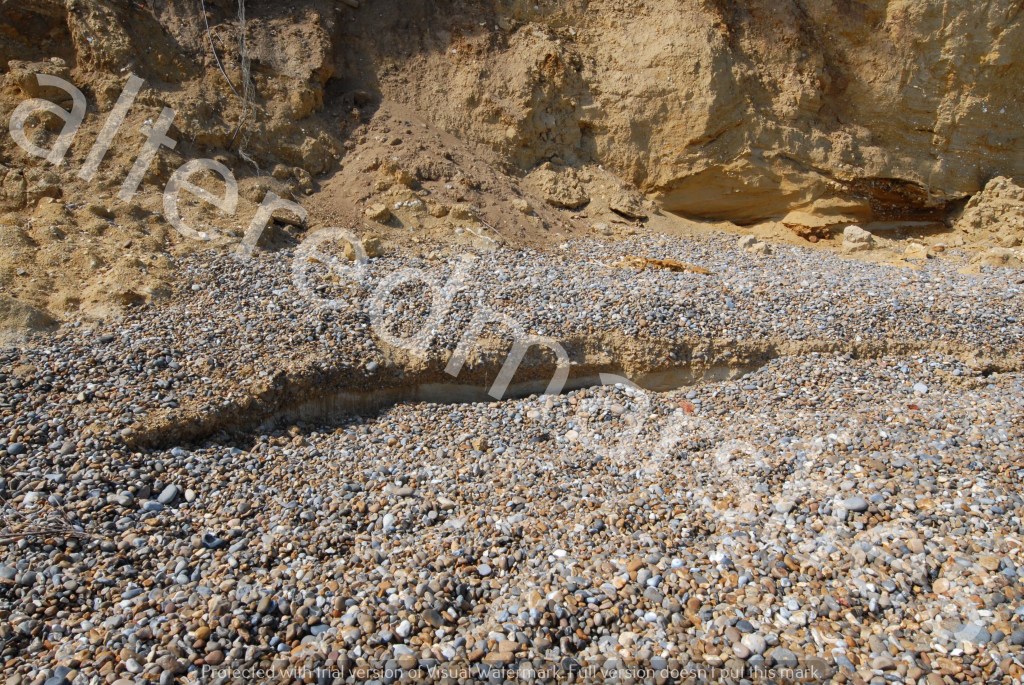
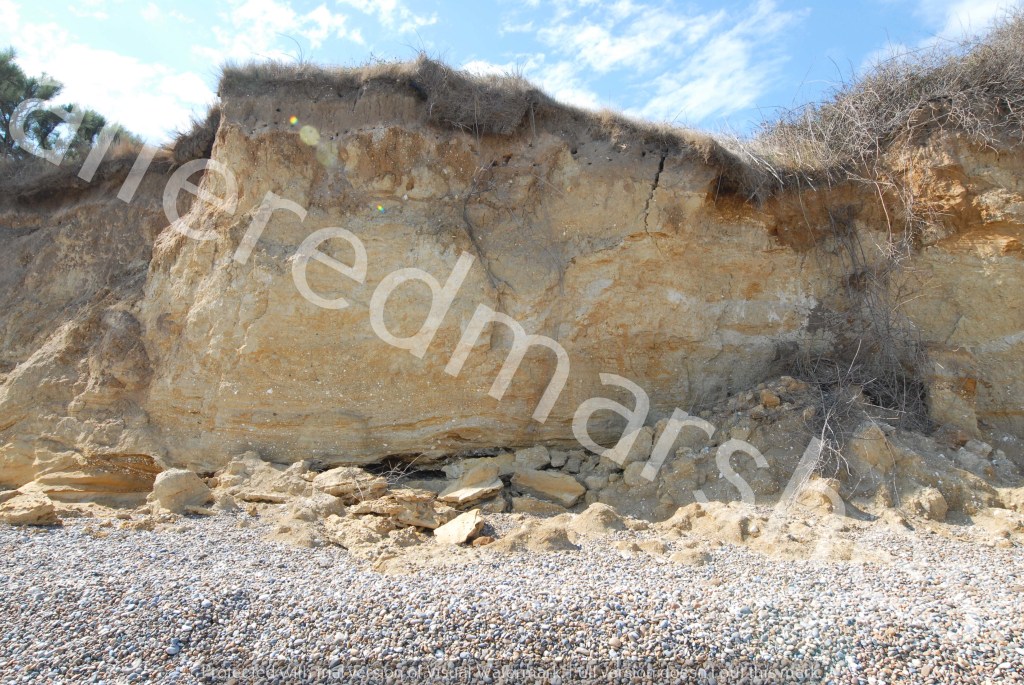
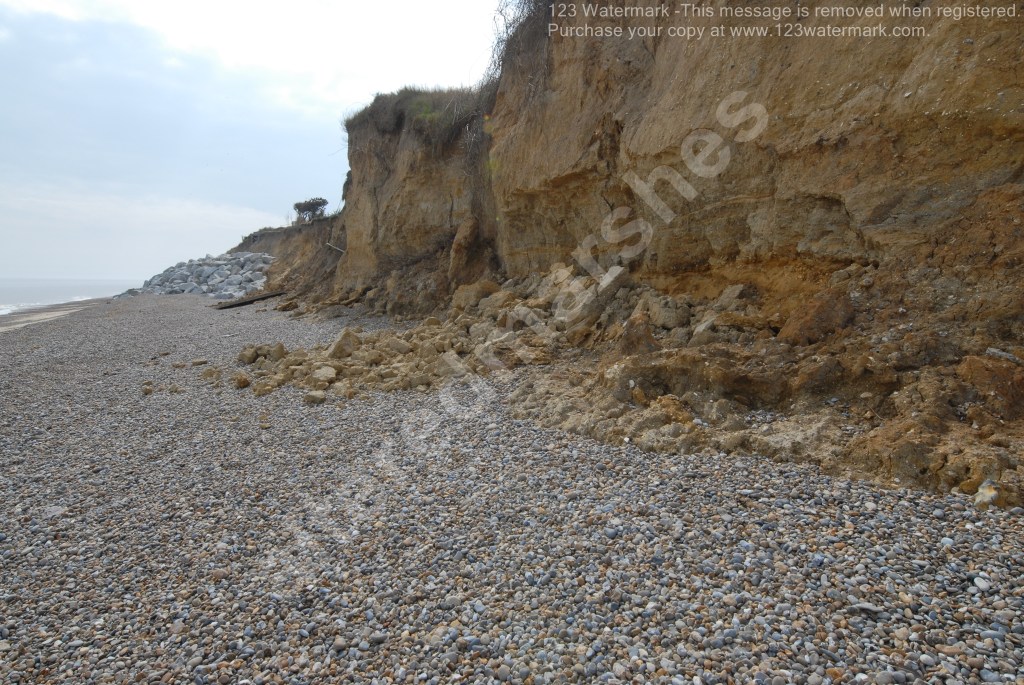
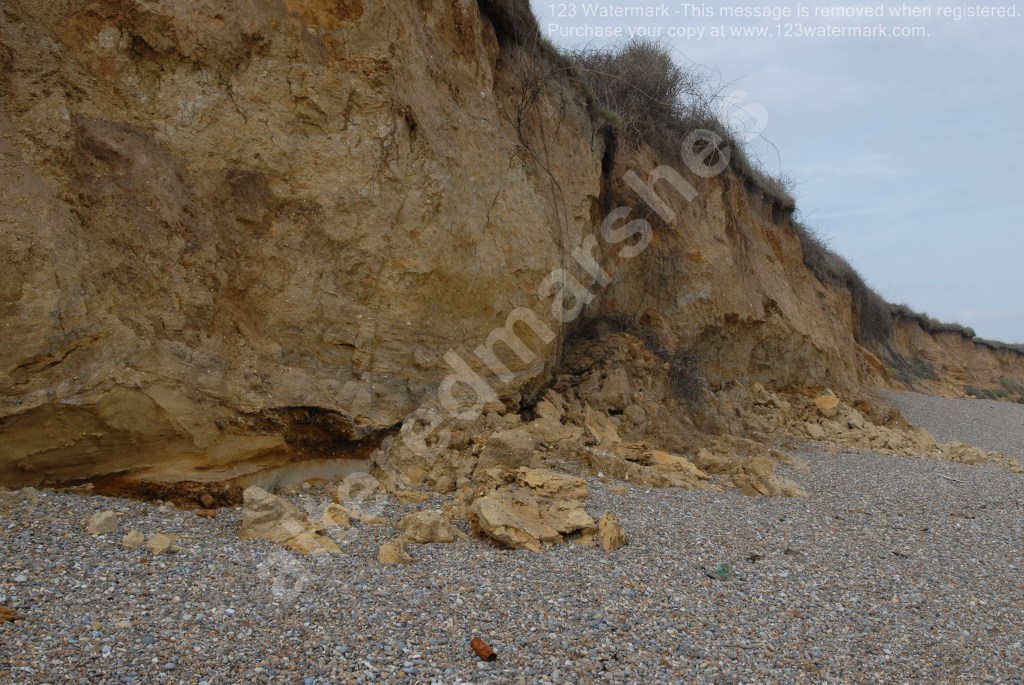
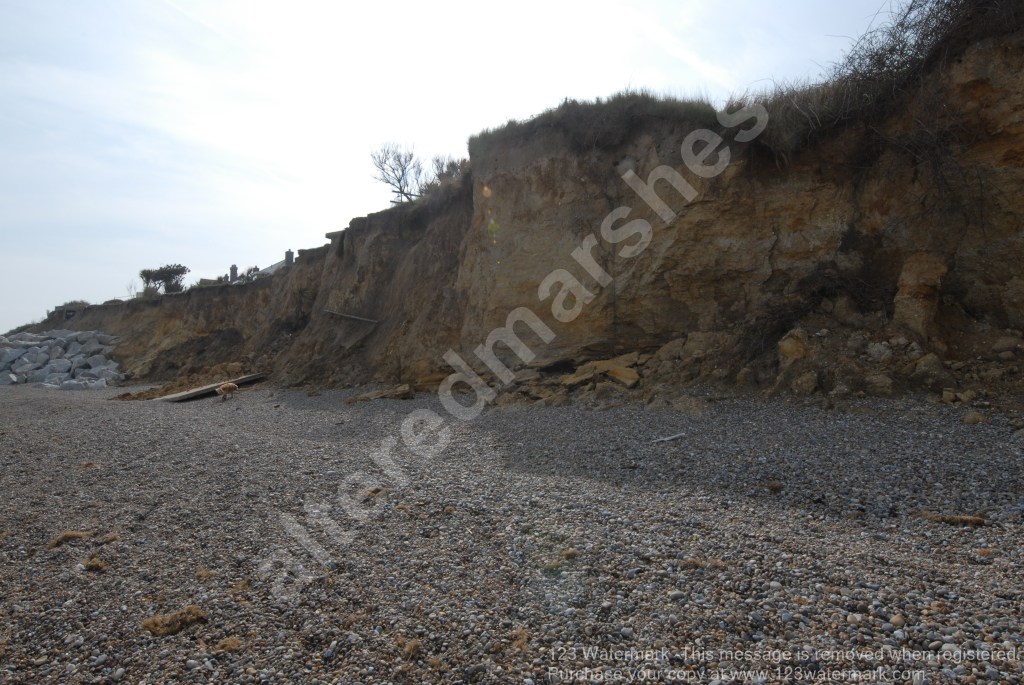
Wave action on 24th February had already caused a large Scarp to be formed on the beach, this feature is defined as a steep slope formed by erosion, with the verb describing a process to wear or cut to form a steep slope. The Scarp is estimated to represent a 10 ft drop in beach material.

Scarp caused by wave action at Hemsby Beach. Photo taken by Hemsby Beach Cafe at night on Friday 10th March.

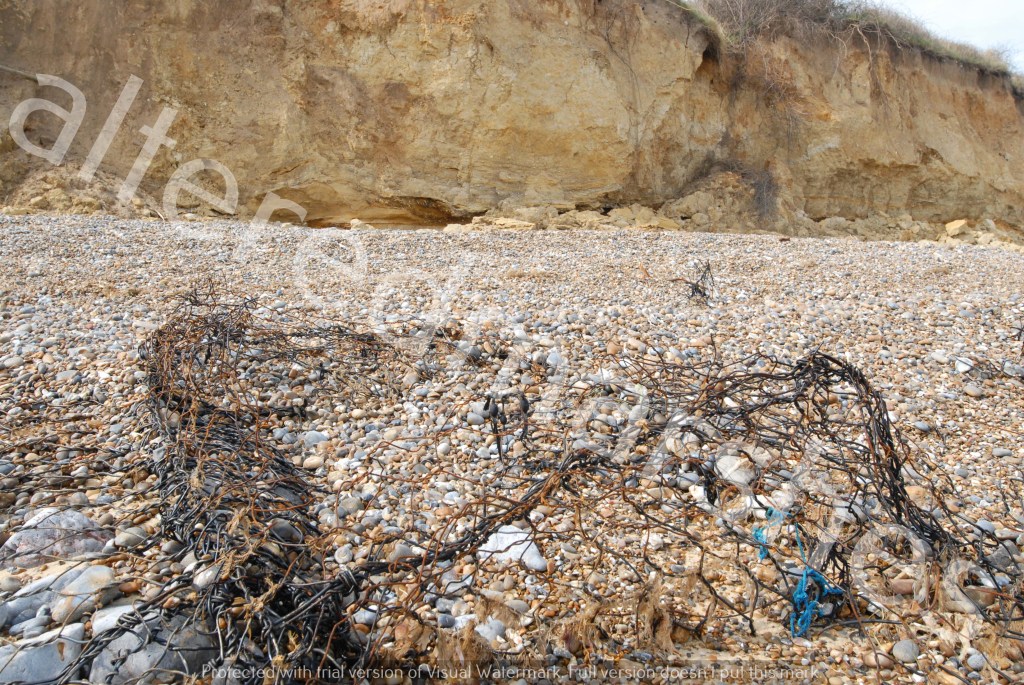
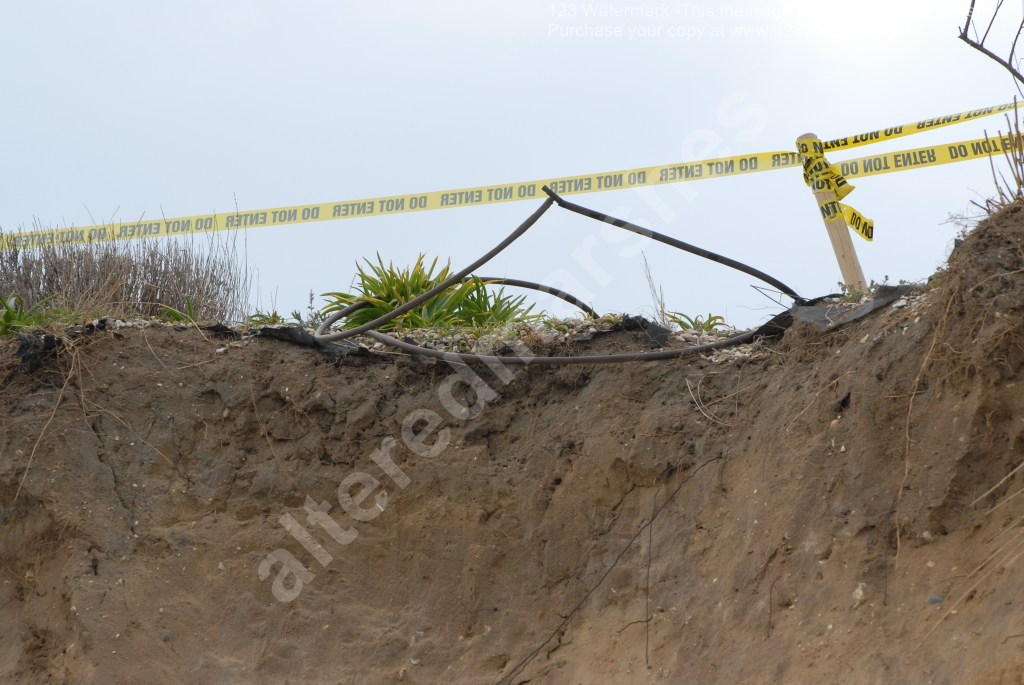
Conditions on the beach at Hemsby on the 10th of March were observed by Hemsby Independent Lifeboat crew and Hemsby Beach Café. They described the sea seeming to sound evil in the early hours of 10th March. Significant damage at Hemsby includes metres of cliff loss, which has resulted in residents undergoing the traumatic experience of seeing their home demolished. One resident reported around 17 ft of cliff material lost (just over 5 metres) in the space of a week. Videos of the storm surge on Friday taken by Hemsby Beach Café show waves seeming to eat away at the cliff frontage at Hemsby.

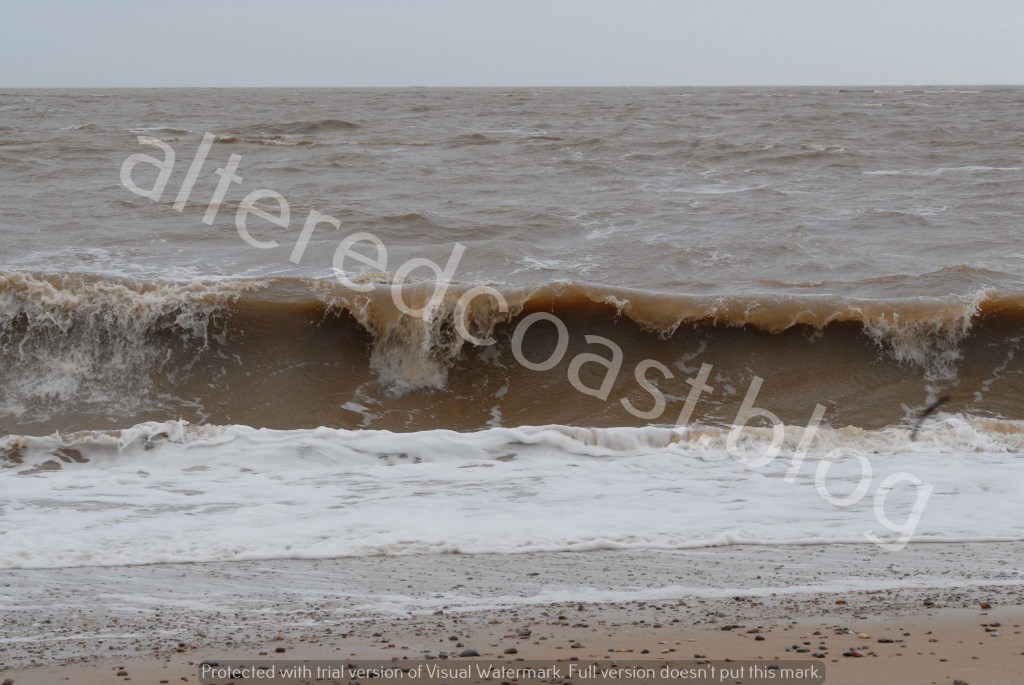
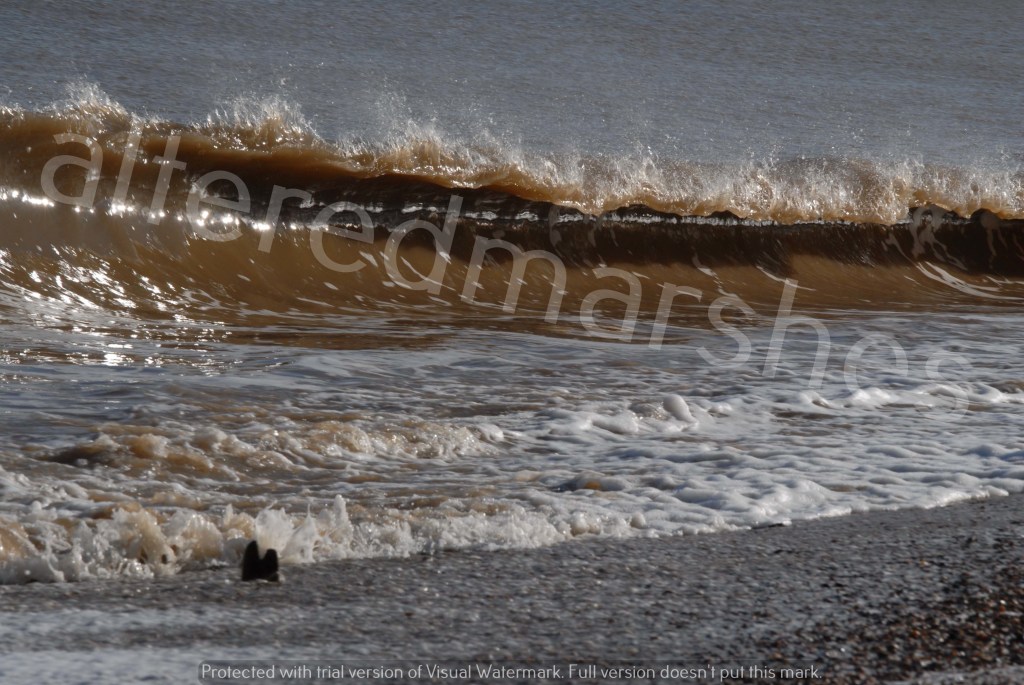
The erosive power of wave action is described quite well in the Observer Book of Sea and Shore. As well as the force of energy within a wave, pebbles can be propelled with force against the cliff surfaces, in addition to the corrosive action of sand against the cliff frontage.

Storm surges continue to bare their teeth, tearing chunks from the coastline of East Anglia, As data, forecasting and ferocious surges conditions on the ground further analysis of the surges reshaping and perhaps forever altering the coastline and perceptions of the North Sea.

Skew Surge

This discussion will combine analysis of annual January tide data from 2015 to the current year, with further consideration of the 1953 storm event, to consider the usefulness of a Skew Surge. The total difference between Maximum Predicted Astronomical Tide and Maximum Observed High Water.

To begin with a look at annual observed Tidal High Water (HW) data for Lowestoft, from January 2015 to the present, each year the chart is updated to show annual tide data for the dates of 1st, 15th and 30th of January. The data for 2023 can be seen towards the end, on the right-hand side of the chart. For the 1st January, maximum observed tidal HW was 2.665 metres, for 15th January, it was 2.918 metres and for 30th January, the value was 3.019 metres.

The data is obtained from the National Tidal and Sea Level Facility, provided by the British Oceanographic Data Centre and funded by the Environment Agency.

To consider the skew surge, for the dates in January 2023, the table below shows the values for Maximum Predicted Astronomical Tide and Maximum Observed HW, and the Skew Surge for these dates. The figure for the skew surge is obtained by calculating the difference between the Maximum Predicted Astronomical tide and Maximum Observed HW.

The data obtained from the National Tidal and Sea Level Facility, provided by the British Oceanographic Data Centre and funded by the Environment Agency, and the National Oceanography Centre.

It is interesting to note how values for 1st January and 30th January, occur quite close to predicted tidal HW, though a skew surge value applies whatever time it occurs within the tidal cycle. This useful to note, as recent flood warnings at the end of February highlighted that a storm surge can occur either side of predicted high tide. A diagram from a paper to discuss tide and surge independence illustrates the position of a skew surge, in a tidal cycle.

A skew surge can occur on any tide, and occurs independently, as the value only shows the difference between predicted and observed HW. So a Skew Surge could be framed as analysis of what constitutes the elevated portion of HW, the factors that create this elevation, and its significance in storm analysis.

To consider this, the Skew Surge on 15th January 2023 can be used as an example. Maximum Predicted Tidal HW of 2.37 metres, occurred at 02:12 am, and Maximum Observed HW at 15:45 pm. Low pressure dominated, ranging from 995 to 1993 mbar, winds blew from a Southwest to Northeast direction, wind speeds increased from 18-20mph at the start of the day to 24 mph around 09:20-11:20 am.

Weather conditions can help explain a rise in observed sea level. Especially because on the January 2023 dates, all three tides were Neap Tides, when tides are smaller than usual. Regarding the 1953 storm, the scholar Steers in 1953 wrote that surge conditions in 1953 could have been even more serious had the surge occurred on a high Spring Tide. Steers states predicted Spring Tides were around 1-3 ft less than occur at other times of the year. This suggests the main cause of damaging sea levels in 1953 were meteorological conditions on the night. The Skew Surge on 31st January 1953 was 2.41 meters at Lowestoft, whereas in 2013, the skew surge was 1.98 metres, even though the astronomical Spring Tide was higher in 2013.

A Skew Surge can contribute to analysis of a storm by indicating likely presence of specific, local conditions capable of generating dangerous surge conditions. But further information is still needed to ascertain its significance. Predicted tide height, levels of low pressure the breadth and duration of a surge, whether high water was still or agitated, wind speed and direction, all important indicators of the severity of a storm.

Values for Observed Tidal HW, in the January chart and the Skew surge for the January dates, show elevated sea levels and indicate the particular nature of a surge. These characteristics can contribute to an understanding of troubled sea levels and the power of the infamous surges of the North Sea.

Power of the Sea

Anyone who has been among mountains knows their indifference, has felt a brief, blazing sense of the world’s disinterest in us. In small measures, this feeling exhilarates. In full form, it annihilates.” –

Quote from film Mountain.

Waves breaking on beach at Orfordness. 7th August 2021

The sea inspires fascination, its otherness captivates and evokes awe and a sense of calm. But it is also a wild, phenomenon governed by natural influences, independent of people and homes and daily life. Storms like the 1953 surge, are a concern, because they remove the distance between humans and the weather. Normally, the weather happens around us, but it doesn’t directly impede daily life, or place people, and homes in peril. Storms operate as a natural force, acting according to rules, which may align with the laws of physics and meteorology, but operate with a force and ferocity, incomprehensible to humans and completely indifferent to their presence.  

Analysis by Wadey, Haigh, & Nicholls et al. identify particular characteristics that made the 1953 storm so destructive. The Low-Pressure epicentre, (known as Low Z) (Pollard, 1977), which at one point, dropped to 964 mb, produced extremely strong northerly winds over the North Sea. The storm’s trajectory from Ireland to Europe, featured an abnormally slow journey to the coast of the Netherlands. This created a lengthy north-south wind system over the North Sea, widening the area in which the wind could generate waves. This strengthened storm surge formation, and gradual amplification of northerly winds severely enhanced wave heights causing the sea state to deteriorate further. These conditions hit East Anglia severely because the rotation of the earth, deflects water to the right of tidal currents. As tide and surge travel in a southerly direction, the height of both, and shallower bathymetry (depth) in the southern North Sea, push large volumes of water towards its coastlines.

Waves breaking onto a beach at Slaughden, Aldeburgh, Suffolk 21st April 2024

Ferocious conditions on the night of the 1953 storm, set the scene for the assertion in the book North Sea Surge, by Michael Pollard, in which he writes:

“It is not journalistic fancy to write that the North Sea went mad on the night of 31st January 1953”

It is also claimed the insane rage of the North Sea had a return period of around 1-3000 years in some places. With a storm of such a size, and intensity, how can humans be expected to develop comprehensive, resistance, with warnings and defences to manage such a force of nature. Especially as Michael Pollard also writes that for several hundred years, at least, it has been very difficult to know without consulting maps and records, and sometimes, even then it is not clear where sea and land begin and end according to early archives. History has always told of a constant battle between land and sea.

It is perhaps, then not useful to draw inferences with today and the preparedness of coastal areas for future storms, by considering insights from Pollards book. In which he writes that tides can be predicted years ahead with some accuracy, but surges, tend to disrupt this accuracy. Reports describe how the inner landward facing walls of embankments failed, enabling the sea to overcome communities from the rear, sometimes many hours after sea facing defences many miles away had withheld the sea.

Waves at Pakefield Beach. March 29th 2024

In the days before the storm, observers, noticed the tides were not completely leaving the estuaries, before the next tide came in. It was also said the motion of the sea seemed strange, and there were concerns about winds. In parallels with today, concerns exist about the robustness of clay embankments and flood warnings regularly refer to the tide locking affect, when the previous tide is preventing from leaving as the next high tide comes in.

The wildness of the sea, came crashing through people’s doors without warning on the night of 31st January 1953. The magnitude of a storm of such severity invokes a constant tension between balancing the perception that coastal conditions can be made measurable and manageable. With the awareness that the enormous violence of storms makes them unpredictable, with communities increasingly aware of the restless, unruly neighbour, that dominates the coast.

Waves breaking on shoreline at Pakefield Beach. 29th March 2024

The insights from Pollards book that describe the behaviour of the sea before the night of the storm, suggest that perhaps part of remembering the storm surge of 1953, is a realisation that there are natural systems and processes, the strength of which we do not totally comprehend. Phenomenon we can never totally get the measure of.

The characteristics of the 1953 storm described above, describe the basic meteorological conditions for the storm. But they don’t describe the human story of how communities comprehend the feeling of the raw fury of the sea and its indifference. People who lived through the 1953 storm, convey the sense that a grave injustice surged through streets once thought familiar and safe. Leaving a tragic, indelible memory of broken homes, boats and dampness in the walls that cannot be removed.

The 1953 storm was a severe assault on the coastline and the people and animals that live along it. Storms and high seas have plagued the North Sea Coastline for hundreds of years. In 2013, a storm which equalled if not exceeded the extreme conditions in 1953, hit the North Sea coast, only this time damage was not as severe as defences and warning systems were much more advanced. But on the dynamic, storm driven, East Anglian coastline, it is still perhaps, the unknown power of storms, indifferent to their effects, which prove that you can never underestimate the power of the sea.

Waves breaking on Orfordness Beach. 7th August 2021

Sea State – Tides Surges and Weather

A wave breaking on Minsmere Beach in Suffolk, October 1st 2022

This discussion will look at tides and surges to consider whether the data suggests the presence of conditions likely to cause beach erosion. This will follow-up a previous debate concerning big vs small erosion events, that looked at the transformation of Thorpeness beach, below North End Avenue between 27th August and 1st October 2022.

Values from Spring and Neap Tides will be examined. Spring Tides occur during Full and New Moon, when the Sun and moon align directly with the earth, this considerably increases the height of the tide. Conversely, when the sun and the moon are at 90 degrees, to the earth, a Neap Tide occurs, with an especially small range. Both Spring and Neap tides occur once a fortnight.

Data for five dates selected in the table below, show in the first line for each date, the highest tide value and in the second line the highest surge value. One 13th September the highest tide value is 3.212 metres, and the highest surge value, 0.398 metres. The surge (residual) as it is called is calculated from observed sea level value minus predicted sea level, for the time they occurred.

Data obtained from the National Tidal and Sea Level Facility, provided by the British Oceanographic Data Centre and funded by the Environment Agency. The source is the Port, P024 at the site of Lowestoft, with the Latitude of 52.47300 and Longitude of 1.75083 with the start date of 13th September 2022-00.00.00 and end time of 23:45:00 for each date analysed. The Contributor was the National Oceanography Centre, Liverpool and data refers to Admiralty Chart Datum (ACD).

One question to consider is whether surges are independent phenomenon that form as a result of particular conditions. For 13th September, a Spring tide, the surge occurred 1 hour and 15 minutes before High Water. However, it could be said surges originate from the environment at the time, separately from the lunar cycle. On 16th of September, a Neap tide, the highest surge value is 0.649, the third highest surge value in the data above. The surge occurred on a falling tide, at 8:30 am, with a tidal value of 2.194 recorded. The highest tide value occurred 6 and a half hours earlier at 1:00 am and was recorded as 2,683, with a smaller accompanying surge of 0.368. On 26th September a Spring Tide of over 3 metres was recorded, but the two surge values are also both elevated. The highest surge value of 0.756 occurred at 17:45, four hours before high water, with another reasonably high surge of 0.629 recorded at 21:45 at the time of high water.

It is also useful to look at the meteorological conditions at the time the tide and surge values were recorded. A rise in atmospheric pressure causes a 1cm fall in sea level, low pressure causing a rise. As a rough guide, air pressure of 1022 mbar is considered to be High Pressure, 1022-1009 mbar Normal Pressure and 1009 mbar and below, Low Pressure. The table below shows atmospheric conditions for Lowestoft in September 2022.

Data of mbar values and weather conditions obtained from the website https://www.timeanddate.com/weather/uk/lowestoft/historic?month=9&year=2022

For 13th– 20th September, Normal or High Pressure was recorded with air pressure fluctuating around 1012-1027 mbar. However, on 26th and 30th September, there is a noticeable drop in Air Pressure, from 1007 mbar to 998 mbar on the 26th and 996 mbar on the 30th. A significant drop in pressure can indicate storm conditions. On the 26th, air pressure at the time the highest surge was recorded was 1000 mbar and by the time of the highest tide it was 1001 mbar, the drop in Low Pressure recorded earlier in the day. On the 30th, air pressure at the time the highest tide was recorded was 1008 mbar and by the time of the highest surge of 0.833 it was 998 mbar.

The tide and surge data in this discussion, offers some evidence that certain tides were elevated during September, and it can be seen surges can occur separately from High Water on both Spring and Neap tides. However, for three of the dates considered, it was not obvious conditions were present to produce a surge. But for dates, towards the end of September, noticeable drops in low pressure and stronger winds could have generated surge conditions.  Tide and surge values in September and atmospheric conditions don’t provide a causal link between beach changes at Thorpeness and elevated sea states. However, values for 26th and 30th September could suggest an agitated sea state that could move beach material. Though it should be noted tide and surge measurements at Lowestoft are recorded an hour or two before they arrive at Thorpeness. Though it is interesting to consider whether photos of the cliffs at Thorpeness taken on 1st October, show a high-water mark at the top of the cliff. Perhaps concluding the examination of data, atmospheric pressure and the evolving movement of the sea and the land it interacts with.

Cliffs showing signs of erosion, with a possible High Water Mark. Thorpeness Beach, below North End Avenue October 1st 2022

Big vs Small erosion events – the conclusion

Red House on the edge of the cliff above Thorpeness Beach, 2nd October 2022

As Red House in Thorpeness on North End Avenue is been demolished, because of coastal erosion, this discussion will conclude the series to discuss whether large-scale events or small gradual processes contribute the most to erosion.

The previous discussion about Thorpeness, the penultimate in the series, looked at the acute erosion on the beach in the photo above, below North End Avenue. This is a high energy, rapidly changing location. Features of this erosion include the soft composition of the cliffs and the constant shifting shingle and narrowing of the beach width, exposing the base of the cliff at Mean High Water Spring. Additionally, waves arrive at the beach from a South-West or North-East direction, both can cause erosion, though NE waves are thought to contain the greatest potential to scour beaches and cliff. This discussion concluded high wave events cause the most erosion, as the change is so dramatic it is hard to see how beach and cliff can recover. Each simply become playthings for the waves of the North Sea.

However, between August 27th and 22nd of September 2022, and more recently, with the demolition of Red House, the beach has changed considerably. Large amounts of material have been stripped from the cliff frontage with big chunks of material slumped from the cliff. High steep ridges of shingle at the back of the beach, are indicative of even less space between sea and cliff.

Thorpeness Beach, 2nd October 2022

In terms of the sea state in this time period, two wave events on the 31st of August and 16th September, saw a Maximum Wave Height (MHW) at Lowestoft exceed 3 metres, with Significant Wave Height (SWH) below 2 metres. There were several storm surges, with particularly high incidences on 13th, 16th, 15th of September.

Thorpeness Beach 1st October 2022

Overnight on 30th September 2022, MWH at Lowestoft reached 4.22 metres and SWH reached 2.62 metres. Additionally, a storm surge of .833 was recorded on this date at Lowestoft. However, the conclusion to the penultimate discussion in this series, was that high wave events, not surges cause the severe erosion at Thorpeness. But recent events would indicate this isn’t necessarily the case. As the high wave events mentioned above were lower than the 31st March/1st April event that previously caused serious damage.

Elsewhere on the Suffolk coast, this series has discussed desiccated cracking in clay flood embankments and how it can be exacerbated by drought conditions. As the top of the embankment, above the water line, is exposed to meteorological conditions, it can experience tensile stress. This can alter the structure of the soil and cause cracks to form which can extend up to 1 metre deep into the embankment. Should water under flood conditions seep into these fissures, it could cause the inward slump of embankment material leading to a potential breach. Therefore, the process of desiccated cracking could itself be an early manifestation of erosion, which could ultimately lead to the collapse of a flood defence.

The series has also looked at Sudbourne Beach on the open coast near Aldeburgh and Hazelwood Marshes on the Alde Ore Estuary. Both locations are subject to large erosion events but are also being gradually worn away by the actions of the waves. A definition of erosion was used that described it as process in which sediment is removed by weather driven wave action and transported away from the area being eroded to another location. This discussion considered the stages of damage to a shingle bank or an estuary path and asked at what point is the damage assessed to have occurred. The moment a structure is breached or destroyed, or when incremental altering begins that can weaken and damage structures over time.

In a recent visit to Hazelwood, the work of the Suffolk Wildlife Trust, who manage the site, can be seen to fill in eroded edges of the path, leading to the bird hide, and buttress them with branches from old salt-water scoured trees.

Hazelwood Marshes, Alde & Ore Estuary 2nd October 2022

Out on the inter-tidal area, it is evident the sea is eating away at the edges of the islands built up to enable Avocets to nest. It also wasn’t possible to examine the banks at the back of the reserve, as unusually, water from previous high tides prevented access. But scouring at the edges of the reserve can be monitored and repaired. What could be harder to quantify, is whether damage to the old sea walls enables greater quantities of sea water to access the reserve. Though as Hazelwood exhibits signs it can recover from erosion events, increasing frequent high tides could make continued maintenance of key features, harder to sustain.

Sea walls breached in 2013 and Islands raised for Avocets to nest, Hazelwood Marshes 2nd October 2022

Therefore, this series will conclude with a focus again on perceptions of damage. High Wave events, elevated tides and larger surges have elevated erosion processes, so that not only do they occur in a more dramatic ways, but they are now further developed. So perhaps it is a question of whether the actual act of erosion, removing and transporting of sediment. Or the ultimate conclusion to this process, inundation of a storm surge or destruction by wave action that causes the most damage.

“Playthings for the waves of the North Sea”

Shadowlands. Matthew Green

A piece of broken flood defence with notches in the cliff and gouging of cliff surface. Thorpeness 14/04/2022

The penultimate discussion in the series to consider whether large events or small gradual processes contribute the most to coastal erosion, will look at the beach and cliffs of Thorpeness. This area has been subject to gradual long-term erosion, but it is also a dynamic high-energy location where several metres of cliff can be lost in a single storm event. The following features cliff, beach, waves, sand banks, sediment, storms and erosion, will be explored, as they are part of the constant taking apart and altering that occurs at Thorpeness.

To begin with the cliffs, it is useful to consider the geographical make-up, to get a sense of structure. At the top can be seen, glacial deposits of sand, gravel and clays, thought to have been deposited by the Anglian Ice Sheet, around 450,00 years ago. Underneath is a layer of Norwich crag, comprised of marine deposits of fossil shells, bands of yellow and brown sands and clay. The penultimate layer is Red Crag, mostly courser sand and gravel, and this lies on harder Coraline Crag.

Eroded cliffs below Red House, Thorpeness 27/08/2022

The cliff composition gives a picture of how they could be manipulated by waves. Two papers’ Deriving mechanisms and thresholds for cliff retreat in soft-rock cliffs under changing climates: Rapidly retreating cliffs of the Suffolk coast, UK and the Shoreface Dynamics on the Suffolk Coast Marine Research Report find North Easterly winds produce higher waves with greater propensity to scour beaches. Damaging events can occur when NE waves record Significant Wave heights (SWH) that reach or exceed 3.11 metres, as waves of this height have the potential to move substantial amounts of beach material. For example, the event on 31st March 2022 where SWH exceeded 4 metres at Lowestoft caused considerable damage. Storm Surges can produce conditions capable of generating such waves, but they tend to cause damage in different places, in different ways.

Sediment transport is a significant feature at Thorpeness. The paper above to discuss cliff retreat, suggests low-level southerly waves, transport sediment in a northerly direction, possibly nourishing the Sizewell-Dunwich sandbanks. But NE waves scour sediment and transport it in a southerly direction. If we think of erosion as the removing of sediment and the depositing of this sediment at a separate location, then this is the constant process at Thorpeness. This could be why the width of the beach is so narrow, particularly where the most acute erosion occurs. At times the beach appears to be stripped of shingle, whilst at other times, shingle is piled up in ridges at the back of the beach. However, whatever the sediment situation, there appears to be hardly any distance between Mean High Water Spring (MHWS) and the base of the cliff.

View of Thorpeness Beach, with Rock Flood Defence, Shingle Ridges and Red House. 27/08/2022

Features of erosion include notches in the beach and base of the cliff and removal of substantial sections of cliff frontage. There is considerable slumping of debris from the top and the bottom of the cliff deposited on the beach, along with trees, turf and concrete slabs from gardens above.  

Each feature discussed above contains complex properties that interact and evolve on this coastline. High wave events could weaken cliffs and cause cliff retreat, in the years that follow storm events. But perhaps it is too simplistic to identify large erosion events as the cause of erosion. Fragile composition of the cliffs could mean they will inevitably erode over time. The beach constantly changes, when shingle accretes, this could mitigate erosion.

Notches in the beach and base of the cliff, Thorpeness. 27/08/2022

New notching into the beach, widening of notching at the cliff base and new desiccation cracks in August 2022, occurred during summer months when very few storm conditions were recorded.

Desiccation Cracks in Cliffs at Thorpeness. 27/08/2022

But it is the severity of the erosion during high wave events and the significant way they change the cliffs and beach, that suggest these events contribute most to coastal erosion. Particularly as they make mechanisms of recovery hard to envisage at Thorpeness. Complexity of the erosion and the characteristics and frequency of high wave events set the scene for the playthings of the North Sea.

Perceptions of Erosion

Erosion into shingle ridge, at top of concrete block flood defences, Sudbourne Beach, near Aldeburgh

This discussion is the second of a series, to debate whether big events, such as surges or high waves, or smaller gradual processes, cause the most erosion. This second conversation will look at erosion at Hazelwood Marshes in the Alde and Ore Estuary and Sudbourne Beach on the open coast. These areas have been selected because they provide examples of both small- and large-scale erosion. To frame this discussion, an initial definition of erosion will be used that describes it as a process that takes away physical substances, from the earth’s surface, mainly earth, sand or shingle and conveys this sediment by weather driven process’s such as wind or water from the focal point being eroded.

To begin with a consideration of Hazelwood marshes, it is necessary to acknowledge an immediate contradiction in the context of a discussion of whether erosion is caused by large- or small-scale events. As anyone who knows the history of Hazelwood, knows the reserve used to be a freshwater marsh, but was made intertidal on 5th/6th December 2013, when a large storm surge, caused the embankment flood defences to breach, leading to a permanent inundation of sea water into Hazelwood marshes. Therefore, it could be said that it is case closed, it is the large-scale flood events that cause severe erosion.

But in the case of Hazelwood, since the storm surge breach in 2013, it could also be said it is the gradual, small actions of waves, that could be significant. When you walk along the raised path to the bird hide at Hazelwood, when the tide is coming in, there is a noticeable change as the tide water which has been silently creeping in begins lapping at the side of the bank below the path. It is this constant movement, the tiny incremental expressions of energy, that could be said to be nibbling away at the banks on the reserve.

Erosion on the side of path facing the estuary, on the way to bird hide at Hazelwood Marshes

In the last few months, Suffolk Wildlife Trust who manage the reserve have removed a line of dead blackthorn trees and scrub scoured by intertidal salt poisoning. The materials were removed so they could be used to help support the structure of the path to the bird hide and infill some eroded sections. Erosion of the grass banks at the back of the reserve, below the holiday property, Marsh View is also visible.

Scouring into grass bank at back of reserve at Hazelwood Marshes

It is also noticeable how high the tide line appears to be, continuing the discussion of whether it is significant high water or the gradual actions of waves, that is causing the most erosion at Hazelwood.

High Tide line at the top of eroded grass bank, at back of reserve at Hazelwood Marshes

At the open coast at Sudbourne Beach, it is a more complicated picture. The coast is currently separated by a narrow shingle ridge from the Alde & Ore estuary. On the first section of shingle ridge from the Martello Tower towards Orfordness, various flood defences are deployed, such as concrete mattresses, concrete blocks, and large boulders. However, beyond a certain point, the flood defences stop, and the shingle continues without further defences.

The processes of erosion are two-fold. Above the various flood defences, there is significant scouring into the top of the shingle path, making it quite narrow to walk on. Proof, if it were needed, that the North Sea has never had much respect for flood defences.

Erosion at top of Concrete Blocks deployed as Flood Defences on Sudbourne Beach, near Aldeburgh

However, on the section of shingle not protected by flood defences, the shingle ridge has been pushed quite far back and there is evidence of a recent breach at the top of the ridge that separates the beach from the Alde & Ore estuary. It is likely this breach occurred during the high tides in January and February 2022.

Breach in Shingle Ridge, separating open North Sea from Alde Ore Estuary, Sudbourne Beach

To consider the erosion at Hazelwood Marshes and Sudbourne Beach, it is useful to further develop the definition of erosion discussed above. Whilst it is clear that sediment is being removed from the specific areas discussed, it could be said there is also a process of altering, noticeable losses of solid structures.

Therefore, to conclude the second debate in this series, to consider whether erosion is caused by large scale or small processes, the conversation could simply be a discussion about stages of damage. The incremental continuous damage to coastal features or the sudden forceful visibly recognisable events that create a hole or a channel through a seemingly firm feature. Assessment of this damage, as a one-off specific occurrence, or the culmination of damaging processes, could frame an evaluation of the significance of erosion in vulnerable coastal areas.

Flood Embankments – cracking in the heat?

In the lead-up to the two-year anniversary of alteredmarshes, a series of discussions will consider whether it is the big storm surge events that cause the most coastal erosion, or smaller processes that develop over a long period, that weaken flood defences and erode shingle and cliffs.

The first of these discussions will consider The Compact Oxford English Dictionary, definition of a crack, which states that a crack is a narrow opening between two parts of something which has split or been broken. The relevance of this description will be considered in relation to the effects of drought conditions on clay flood embankments. The Met Office recently reported England experienced its driest July since 1935, with the driest on record for East Anglia. Met Office maps for actual rainfall show figures in the range of 0 to 25 mm for the Suffolk area in July 2022.

The collapse of a peat levee during a drought in 2003 in the Netherlands, prompted increased research into the effects of drought conditions on peat levees and earthen clay flood defences, such as we have in the UK. A paper Managing drought effects on levees in The Netherlands and England, focuses on a process known as Desiccated Cracking. Clay flood embankments have what is known as a Phreatic Line – a line that separates the section of embankment under water and the area above the water line. When water in a river or lake evaporates, causing the Phreatic Line to drop, areas of earthen embankments exposed above this line, can become subject to metrological conditions.

The effect of drought conditions on earthen embankments is further developed in a paper Experimental and theoretical analysis of cracking in drying soils. A process called Tensile stress can alter the structures of soils on top of earthen embankments. Tensile stress refers to the highest level of pressure soil can bear before it fails. Tensile refers to pressures that are trying to pull the soil to extreme lengths. Therefore, the point when tension within a material exceeds the ability of the substance to resist the pressure.

Once cracks form in the top section of a clay flood embankment, they can extend into the embankment and reach lengths of at least 1 metre deep. If these fissures form a web, this can convert the clay layer into a rubble like material which increases the permeability of the surface of the earthen embankment. Should a flood occur shortly after a drought, water is able to flow through the fissures which can cause the inward collapse of the inner slope by continual upheaval of chunks of rubble-like material.

Grass revetments over the top of clay embankments can also suffer under drought conditions, with substantial retreating of grass coverage, especially if overgrazing by sheep or mowing of grass occurs around the time of drought conditions. However, should rain return, but not under flood conditions, cracks in embankments and grass coverage can recover, but this is not always the case.

However, there are very few examples of earthen embankments collapsing due to drought conditions. Which brings the consideration back to the debate of whether erosion is caused by large scale events or the effect of smaller long-term processes that can cause a flood defence to fail. In some ways, it is a question, of whether the processes caused by drought conditions, cause more damage than the high-energy, high-volume events in storm surge conditions.

In the case of Desiccated Cracking under drought conditions, the process can change the solidity of a soil mass. A process strongly influenced by moisture content in the material, which is why it is particularly applicable to drought conditions.

This is similarly the case with mud flats and open shorelines which could have negative impacts on coastal nature reserves. As estuary levels evaporate, the progression of tensile stress through a soil mass can lead to fissures in established pressure areas. In this context, [Lee et al., 1988], usefully apply the word brittle to describe the soil state. However, in the case of a flat expanse of mud, the ground could also be hard and compacted, with deep running cracks, that make it hard for water to be absorbed, especially in large volumes following a drought.

In conclusion, it is said that water finds its own level and it is the flood events that erode networks of cracks in embankments. However, it could also be the case that the process of desiccated cracking, is itself an early manifestation of erosion that reaches an advanced state and is ultimately concluded by flood events when they happen.

Tides and Surges

This discussion will travel down the east coast with the tides and surges of East Anglia and will consider how the features of the North Sea influence tidal patterns. Along the way, it will also consider the tendency of surges to occur around 3 to 5 hours before peak high tide.

The shape and position of the North Sea can be said to contribute to the tidal ranges on this coastline. At its northern end, the North Sea links to the North Atlantic through a large channel that passes by Scotland and Norway. At its southern end, the North Sea squeezes through a narrow strip to the English Channel. The tidal system is created predominantly by astronomical, semi-diurnal tides from the Atlantic. Semi-diurnal tides are those which see two high and two low tides of roughly equal size every lunar cycle. Tides rotate around centres, known as Amphidromic Points, and thanks must go to the Environment Agency in providing information about these points, of which there are three in the North Sea. The 1st Amphidromic Point is located in the Southern North Sea near the English-channel, the 2nd in the centre of the North Sea and the 3rd, close to the coast of Norway.

At the centre of Amphidromic Points, the sea is almost stationery with barely any tide. However, tides circulate round these points, as Kelvin waves in a counter-clockwise direction, southward down the coast of East Anglia, every 12 hours, 25 minutes. Each line of the Amphidromic Point represents 1 hour and 2 minutes of travel by a tidal wave, and the furthest from the centre of the Amphidromic Point, higher the tide. For example, at Immingham, placed further away from the centre of the Amphidromic Point in the centre of the North Sea average tide height is around 6-7 metres. Whereas at Lowestoft, located very near the Amphidromic Point in the southern North Sea, average tide height is around 2.5 metres.

The North Sea, is said to be a splendid sea for storm surges.  

(Heaps, 1983).

The position of the North Sea attracts extratropical storms which pass from west to east with the capability to generate energy in the sea. A ‘Storm Surge’, can be formed by atmospheric level pressure acting on the surface of the sea, for example, a 1 millibar reduction in air pressure causes a 1 cm rise in sea level. Another contributory factor, is the effects of wind blowing over large areas of shallow water, with the depth of the southern North Sea said to be around 35 metres.

A‘ storm surge’ is therefore a transitory increase in sea level originating from a depression generated by a weather system. The shape of the North Sea influences this process, because when a surge travels down the coast in a southerly direction, it is accentuated by the concentration of storm energy water being driven through the narrow funnel into the English Channel.

A related concept is the extent to which surges occur a few hours before peak high tide. In a paper by K. J. Horsburgh  and C. Wilson, data from 5 tidal gauges, spaced equally along the North Sea Coast at Aberdeen, North Shields, Immingham, Cromer and Sheerness, found the surge frequency to be around 3-5 hours before high tide. This assertion can be tested by looking at significant surges on the Suffolk coast, such as during the storm on 5th/6th December 2013 and the surges that accompanied high tides in January 2022.

Regarding the 2013 surge, it is interesting to note that with a large event like this, it could be problematic to focus on data from 5 specific sites, as you only know when a surge impacted these areas at a given time, whereas outside of these focus points data could show the surge at some locations arrived within between 2 hours or 30 minutes before High Water.

Figures in the table below show peak tide levels and maximum surge heights at Lowestoft for 5th and 6th December 2013 and the 6th December 2022.

Data obtained from the National Tidal and Sea Level Facility, provided by the British Oceanographic Data Centre and funded by the Environment Agency. The source is the Port, P024 at the site of Lowestoft, with the Latitude of 52.47300 and Longitude of 1.75083 with the start date of 05Dec2013-00.00.00 and end date of 23:45:00 for each date analysed. The Contributor was the National Oceanography Centre, Liverpool and data refers to Admiralty Chart Datum (ACD).

The table shows that peak high tide on 5th December 2013 was at 22:30, but the maximum surge height of 2.179 was recorded at 22:00, half an hour before peak high tide. Interestingly, on 6th December 2013, whilst the peak high tide of 4.228 was recorded at midnight, the maximum surge height of 1.856 metres was recorded at 03:15, over 3 hours after peak high tide. Elsewhere during the December 2013 surge, a report by Kenneth Pye Associates Ltd, commissioned by the Alde and Ore Association, gives figures from the Environment Agency tidal gauge at Orford Quay in the Alde Ore Estuary. On 6th December 2013, maximum high water was 3.06 m OD at 01:45 am around 71 minutes before predicted High Water and the surge was 1.66 m.

However, in relation to the high tides and surges of January 2022, figures roughly concur with K. J. Horsburgh and C. Wilson. On January 18th 2022, the surge of 1.2 metres, that travelled up the Alde Ore estuary arrived around 2 hours before normal spring high tide. Similarly, during the high tide and surge on 30th January 2022, peak high water was recorded at 06:15 in the morning with tide height of 3.659 and a surge height of 1.370 m, but the highest surge occurred 3 hours earlier at 03:45 am with a tide height of 3.391 and surge height of 1.728 m. All data is from the British Oceanographic Data.

Discussion of these figures of surges in December 2013 and in January 2022, should in no way detract from the in-depth, analytical work undertaken by K. J. Horsburgh and C. Wilson. Instead, it just serves to demonstrate how the processes of tides and surges are both fixed describable features and fluid dynamic elements. As our journey concludes with tides and surges of the North Sea, it has revealed the complexity of the everchanging forces that move the water in the ocean.

Wind Waves Cliff

In a brief continuation of the previous discussion about high waves and the effect on the coastline, photos below show the current state of the cliffs at Thorpeness, as they were on 14th April 2022.

Multiple slippages can be seen from the cliff frontage, with the surface slumping and collapsing down to the beach at the base of the cliff.

Exposed and collapsed cliff frontage Thorpeness Beach

There also seems to be evidence of carving or gouging, with large indents into the surface of the cliff.

Scouring and carving into surface of cliffs, Thorpeness beach

Pillars and holes seem to have been created by the erosive forces that are reshaping these cliffs.

Profile of the cliff with signs of surface slumping, scouring and pillars created by wave energy

Residents living in properties near the edge of the cliff are managing the rapid erosion as best they can and have added tape at the end of their gardens that say Do Not Enter.

Tape added at top of cliffs, Thorpeness Beach

But the forces, altering and scouring out these cliffs contain an energy that is hard to predict and restrain.