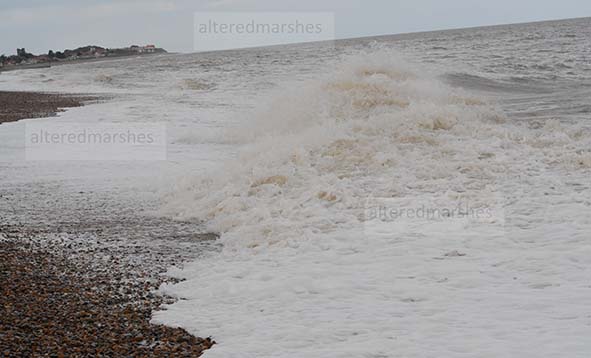
As the coast enters the winter storm season, it is useful to analyse wave patterns on the Suffolk coast and consider recent incidences of considerable wave height. The location of the wave measurements is Lowestoft, where wave data is monitored using a Datawell Directional WaveRider Mk III buoy. The buoy is owned by the Environment Agency, and it was first deployed on 20th April 2016. The source of the data is coastalmonitoring.org.
Consideration of wave data will focus on significant wave height (SWH), defined as the average height of highest one-third of all waves measured. SWH will be considered in relation to maximum wave height (MWH), the highest wave within a wave measuring period. SWH and MWH for the month of October 2021 will be analysed alongside the dominant wave period (DWP), the Tpeak (seconds). This refers to the wave period where the highest wave energy is centred and observing DWP can enable analysis of whether a wave is a product of local winds, or a product of a swell. If the DWP and wave height roughly match each other, this can indicate storm conditions.
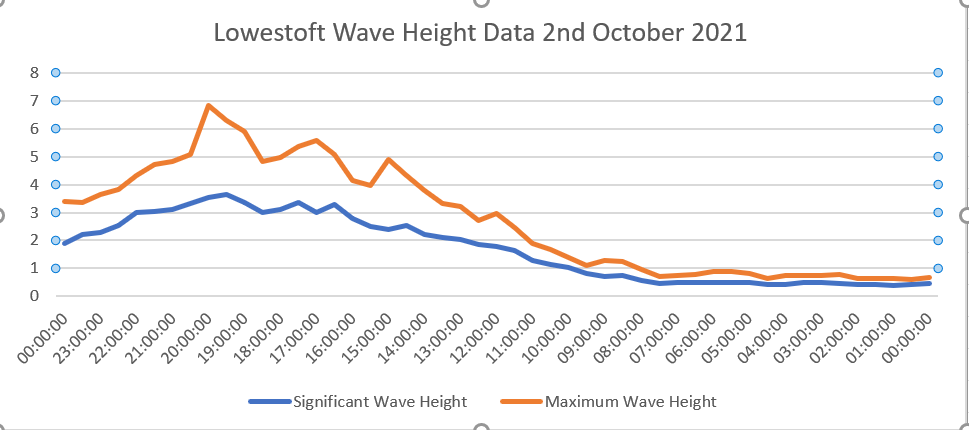
The charts which record wave height data on coastalmonitoring.org, have a red line which runs horizontally, which indicates the storm alert threshold. SWHs above this line can be considered to be a product of storm conditions. Additionally, these waves can be analysed in relation to their return period, whether are relatively common, with a likely return period of four times a year, or whether the SWH has a return period of every 50 years, or a hundred years. The chart on coastalmonitoring.org, for Lowestoft, has a storm alert threshold height of 3.11 metres, with a return period of four times a year. To analyse SWH and MWH in more detail, data from 2nd October 2021 will be considered. On this date, a SWH of 3.64 metres and a MWH of 6.83 metres were recorded.
For the purposes of analysing the high wave data on 2nd October in relation to the Dominant Wave period (DWP), the SWH in metres will be converted into feet. Therefore, on this date, the SWH was 12 ft and the DWP, T-Peak (S), was 8.3 seconds. However, to determine the extent of storm conditions it is useful look at the wave measurements before and after the highest SWH.
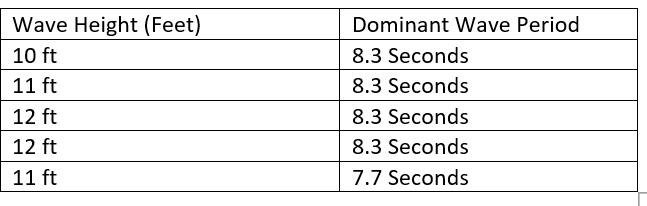
It is interesting to note that the figures for the DWP are very near the height in feet of the SWH. It is acknowledged that when the figures correspond in this way, it is indicative of storm conditions. This would also suggest that waves were forming in a wind-wave environment. As can be seen from the chart showing the SWH and the MWH, the increase in the SWH rises as the MWH reaches its peak. Though the highest SWH was recorded just after the measurement for the highest MWH.
The MWH of 6.83 metres (22 ft) was the highest MWH recorded in October 2021, though MWHs of 6.13 m (20 ft) and 5 m (16 ft) were recorded on 31st October 2021. Though the highest SWH on this date only reached 2.92 metres (10 ft). Instances of MWH over 5 metres are clearly concerning, particularly, if they show signs of an increase from what has been previously recorded for a particular time period. However, the MWH is the height of individual peak waves, whilst SWH is the average height of the highest one-third of all waves measured. As this can be considerably lower than the MWH in any period, the SWH is of interest to coastal engineers, because the storm alert threshold for SWH has a return period of four times a year. Therefore, if the SWH is above this threshold, it could indicate the presence of waves capable of moving potentially significant amount of beach material.
A future discussion will consider this point in more detail by examining a stretch of coast at Thorpeness, in Suffolk which is currently experiencing severe beach erosion, which poses a danger to houses stationed very close to the edge of the eroding cliffs.