Mark of The Storm

Erosion of cliffs below North End Avenue, next to Rock Revetment Flood Defence. Thorpeness Beach 5th November 2023.

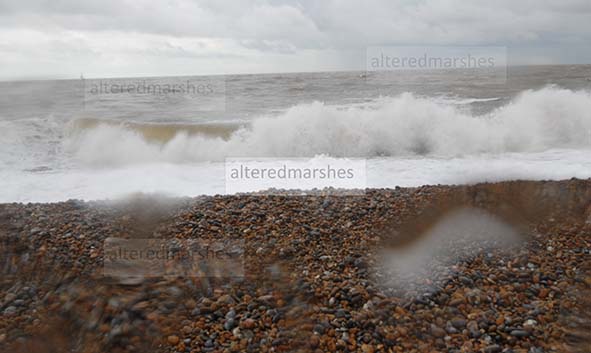
As storms continue to batter the East Anglian coast, this discussion will consider marks left by storms Babet & Ciaran on two beaches in Suffolk and ask how useful it is to examine erosion through the lens of the Palimpsest. The term refers to how a surface or feature, when something new is added, continues to display residues of what was there before.

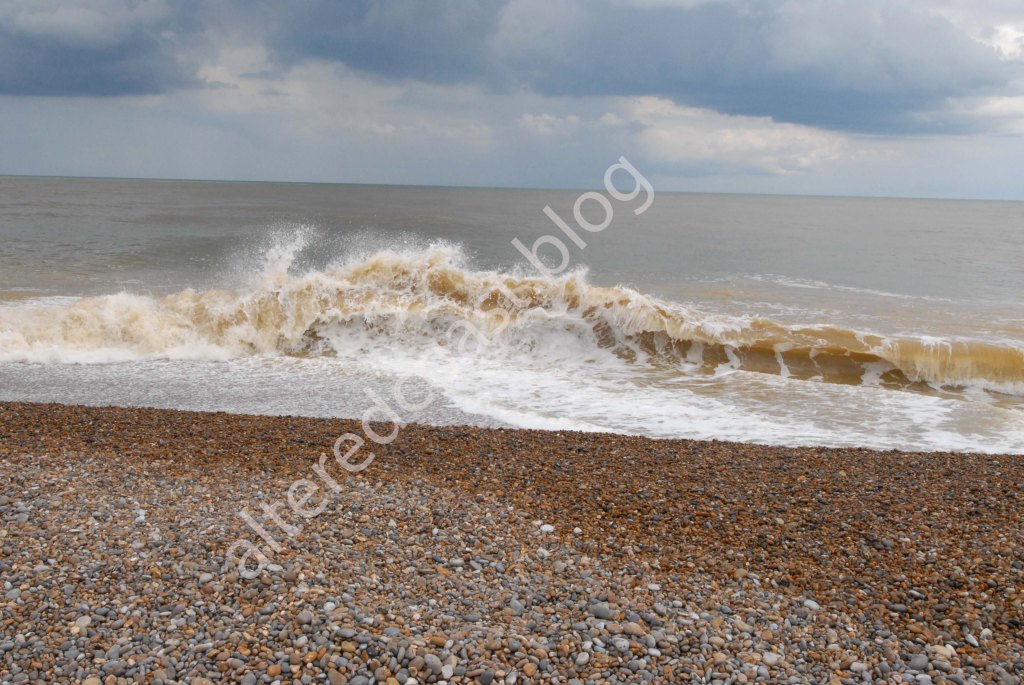
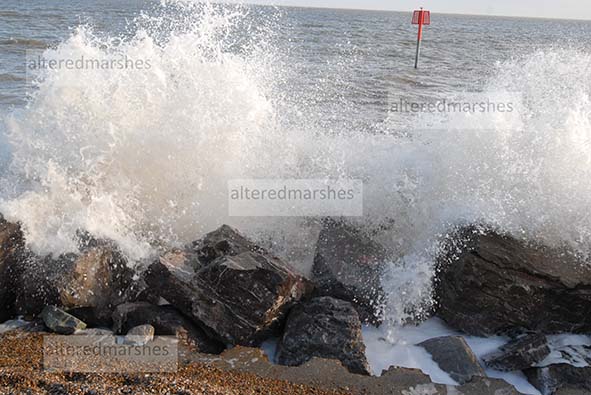
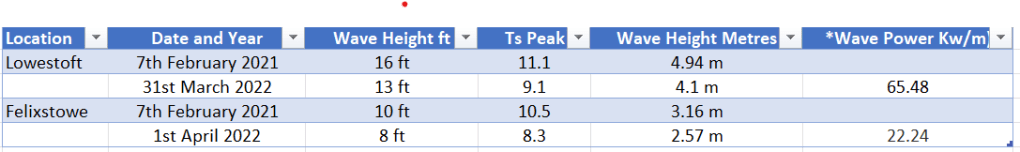
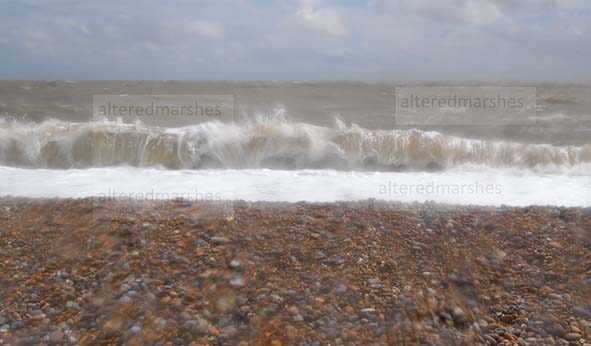
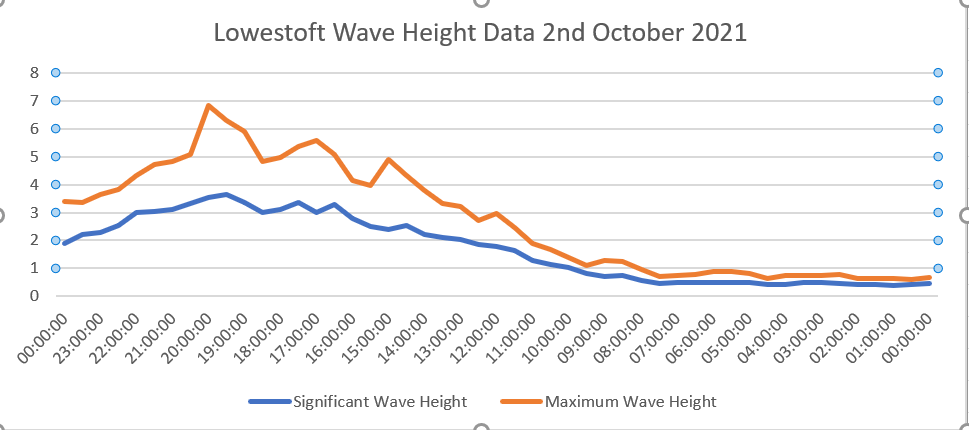
Firstly, data for Significant Wave Height (SWH) at Lowestoft recorded the highest values to date for 2023 during Storm Babet and Storm Ciaran. The SWH Storm Alert Threshold for Lowestoft is 3.11 metres. During Storm Babet, SWH was slightly below this and for Storm Ciaran it was noticeably above it.

Data provided by https://coastalmonitoring.org/, The National Network of Regional Coastal Monitoring Programmes, funded in five-year cycles from DEFRA and administrated through the Environment Agency.

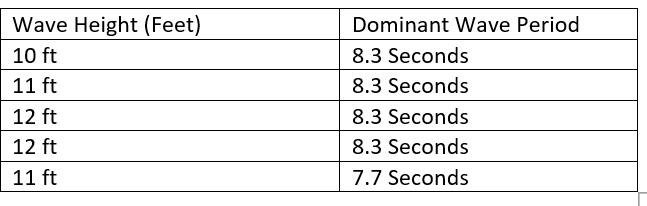
The Tpeak(s) or Dominant Wave Period, (DWP) is the period where the highest wave energy is centred. It is interesting that the DWP is the same for both wave heights. Particularly as the same DWP was also recorded for the highest SWH in 2022, during a storm on 31st March, when a SWH value of 4.10 metres was registered.

It is also worth noting that the highest value for Significant Wave Height was also recorded at Happisburgh, during Storm Babet on the 20th October. A SWH of 3 metres was registered, with a Dominant Wave Period of 6.2. The Storm Alert Threshold at Happisburgh is 2.74 metres.

Data for SWH has been considered because it enables an insight into the turbulence of the sea. It also provides the first noticeable signs of repetitions or noticeable exceptions. Patterns of wave behaviour that indicate continuity or require a new understanding, that learns from and develops, what has gone before. The first consideration of the usefulness of Palimpsest.

This term is discussed in a doctoral dissertation by Alison Stoneman, titled Holding The Line: contemporary poetry of British coastal change. PhD, Nottingham Trent University. Stoneman critically analyses Coastal Erosion poetry, and refers to storm damage on beaches, as sheets of features, that add to and alter marks left by storms before. Following storms Babet and Ciaran, erosion features of Thorpeness Beach and Sudbourne Beach in Suffolk were observed and will be considered through the lens of Palimpsest.

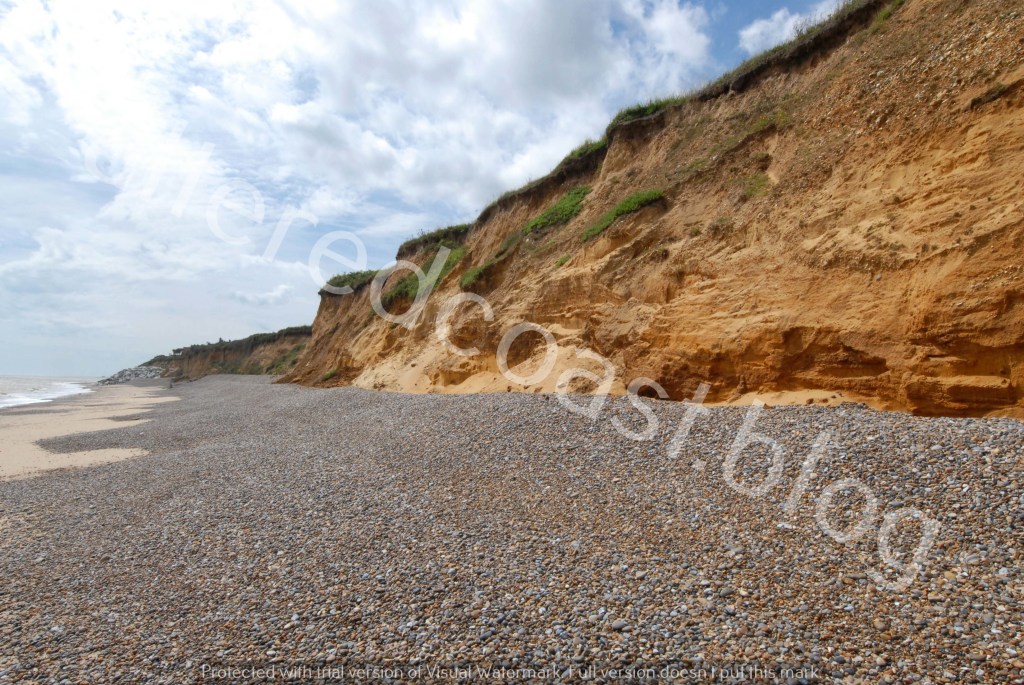
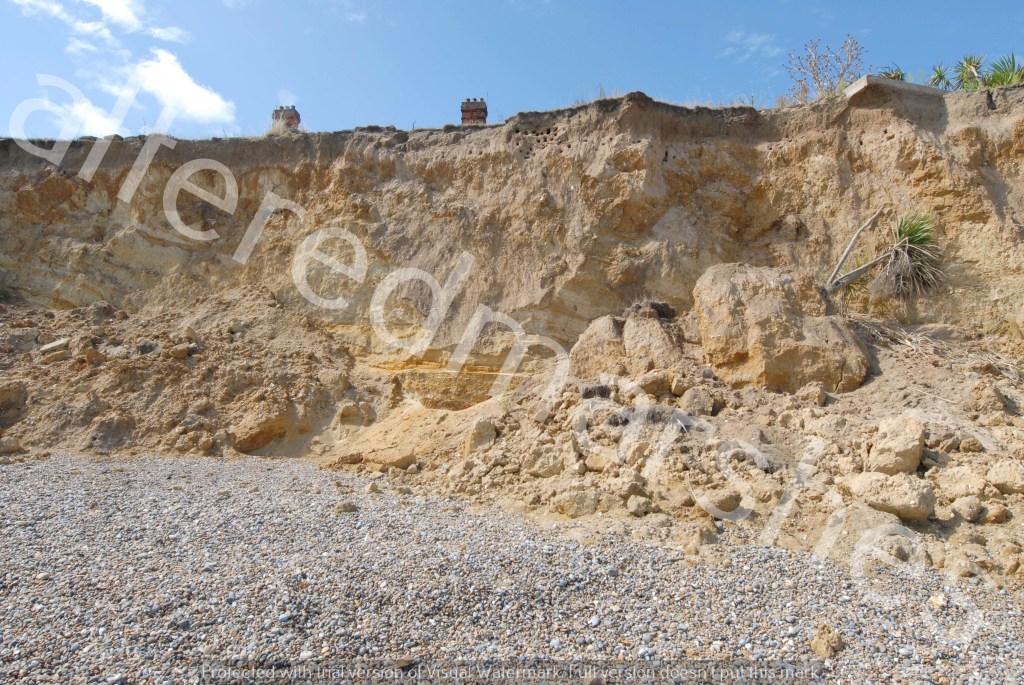
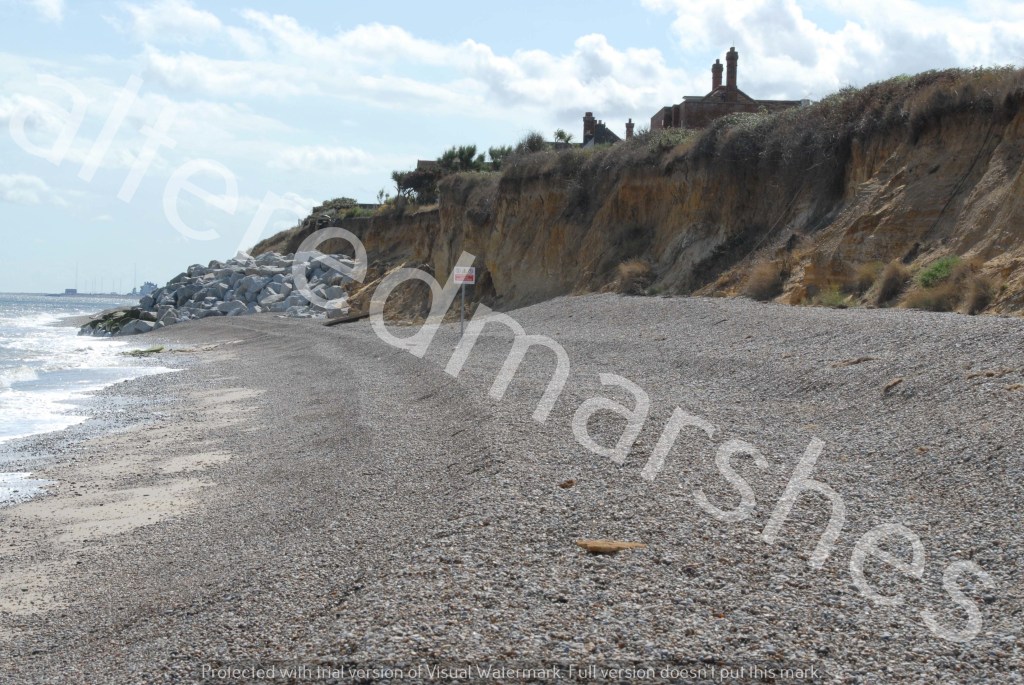
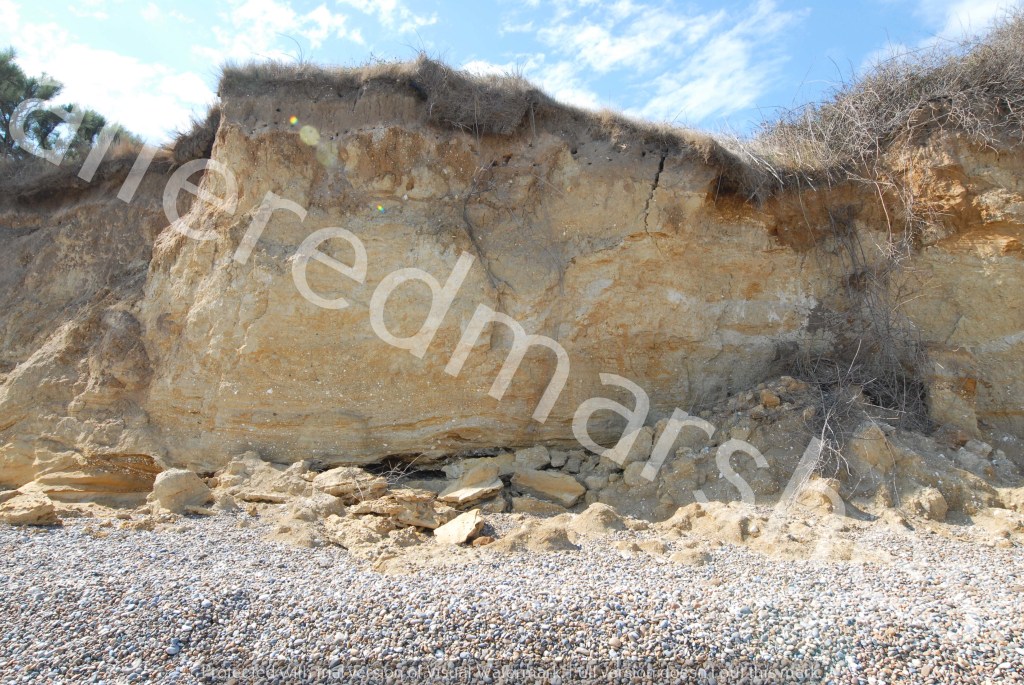
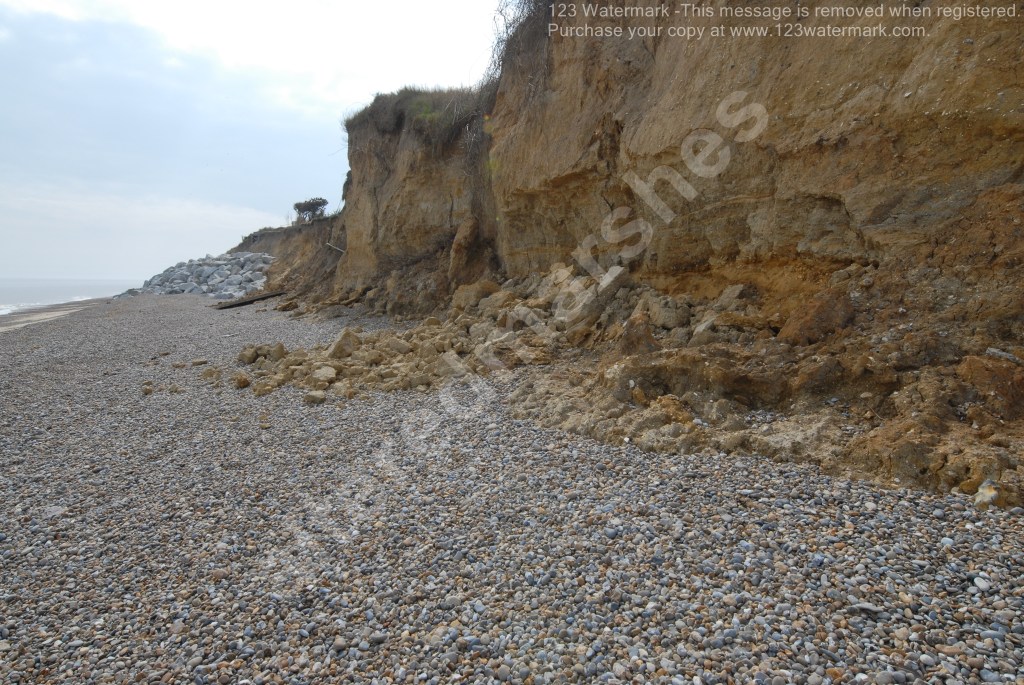
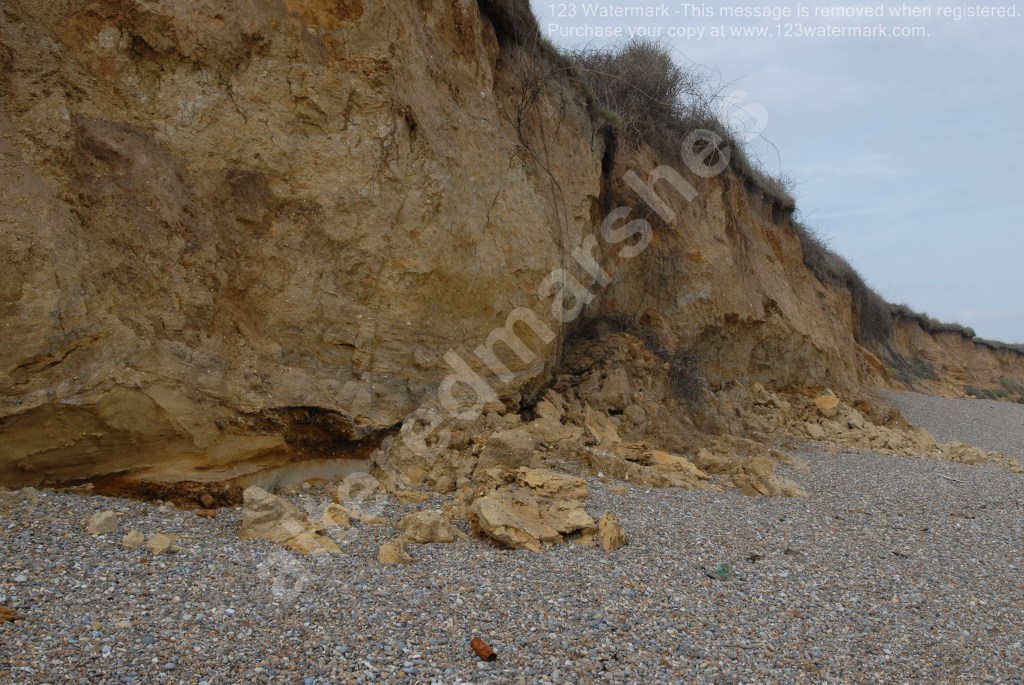
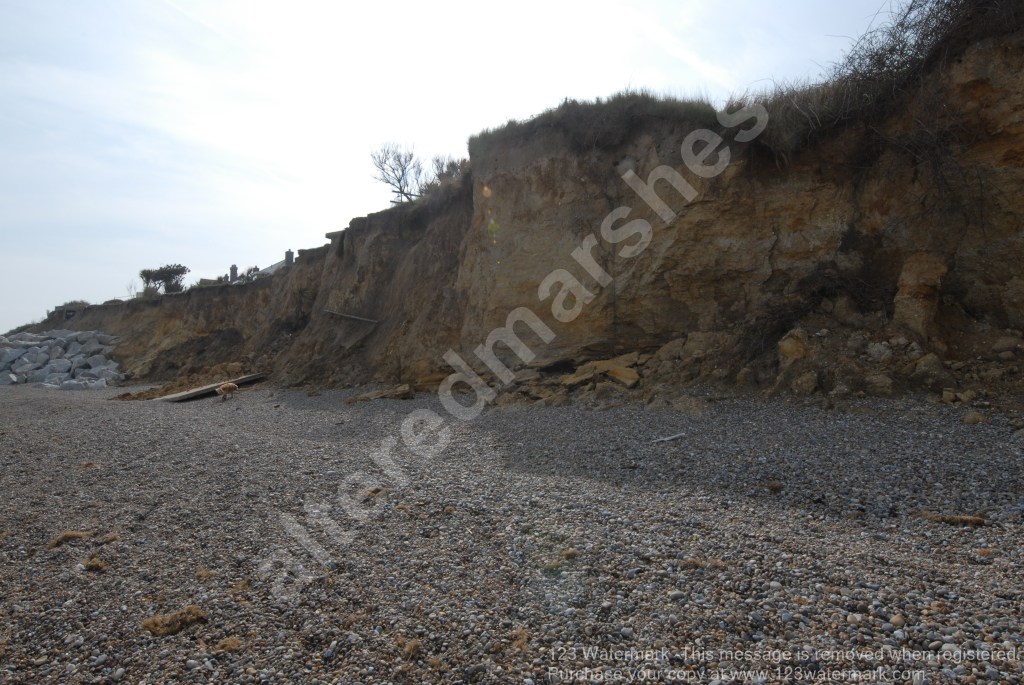
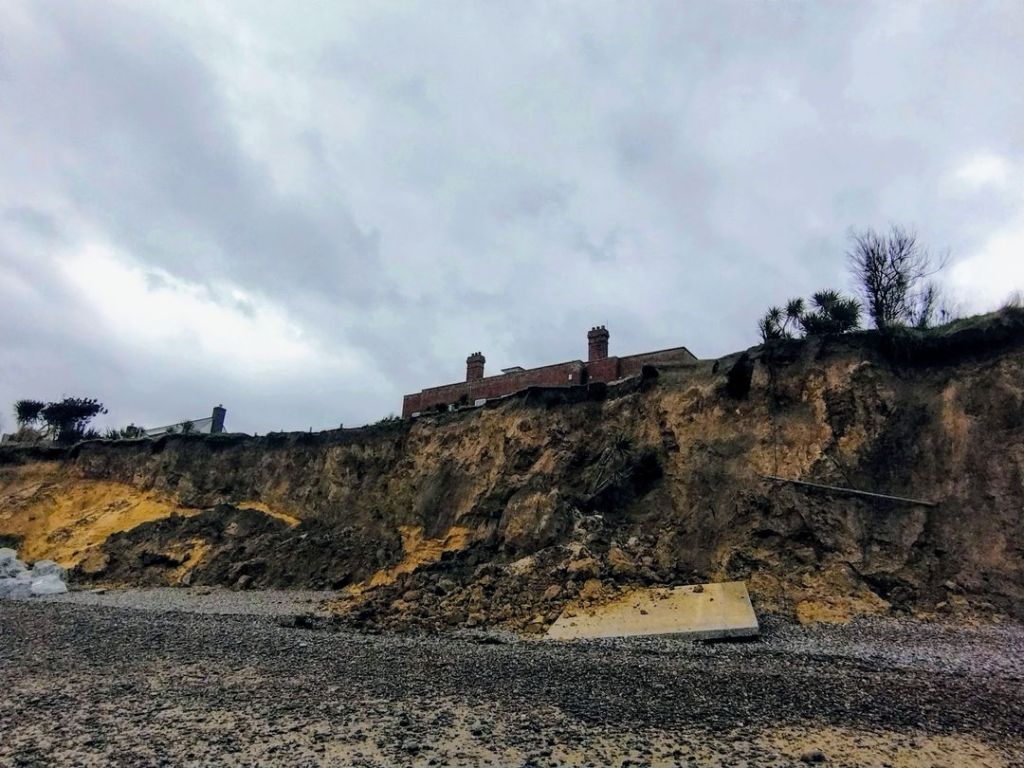
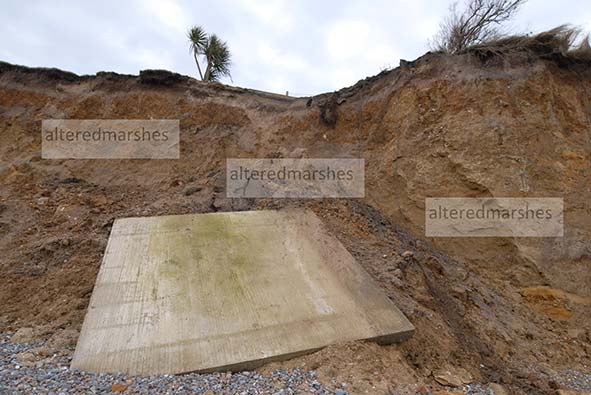
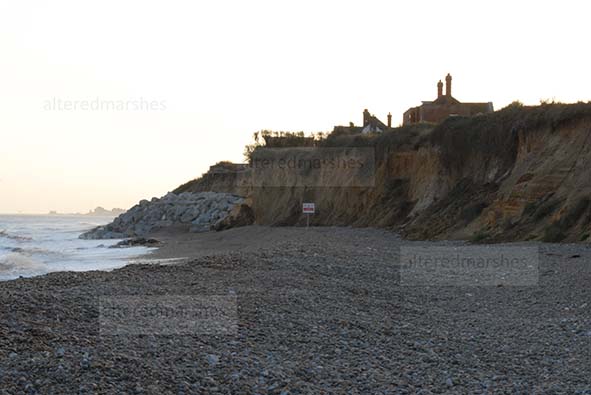
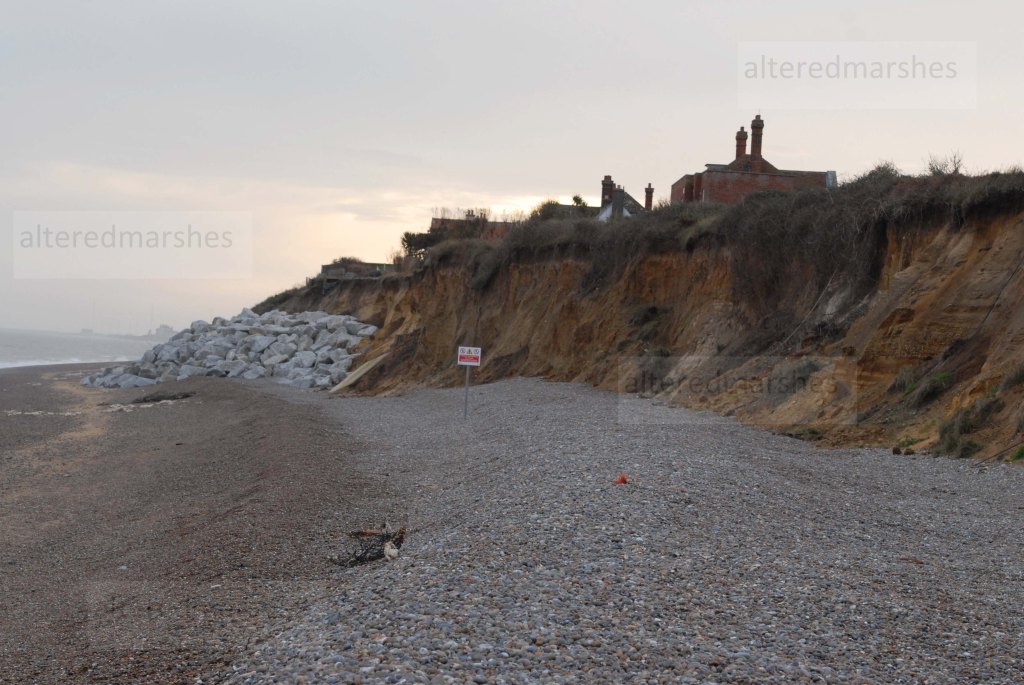
To start with Thorpeness, it might be quite straightforward to consider the framework of Palimpsest as a useful approach to analyse erosion at this location. As observations of erosion on the cliffs, show recent changes set in the context of the geology of the Pleistocene. Even though the beach changes quite dramatically, remnants of what has been laid down previously still show through. This is particularly relevant when considering the Pleistocene and the Palimpsest. As a couple of the poems analysed by Stoneman refer to Doggerland, a stretch of marshland that stretched between England and Europe, that was inundated by the sea at the end of the last ice age.

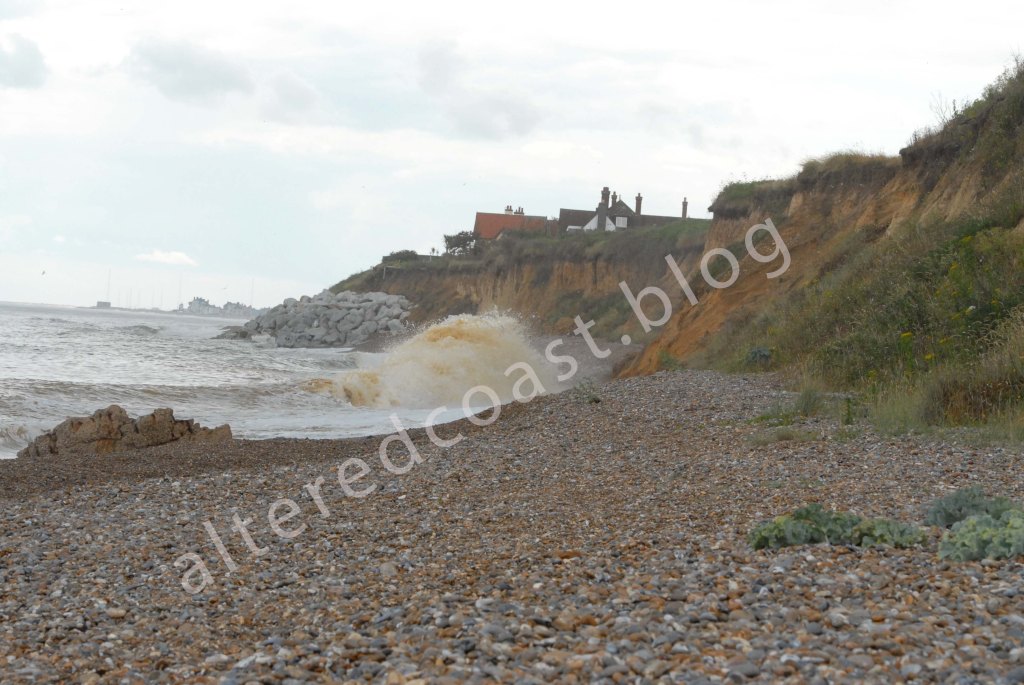
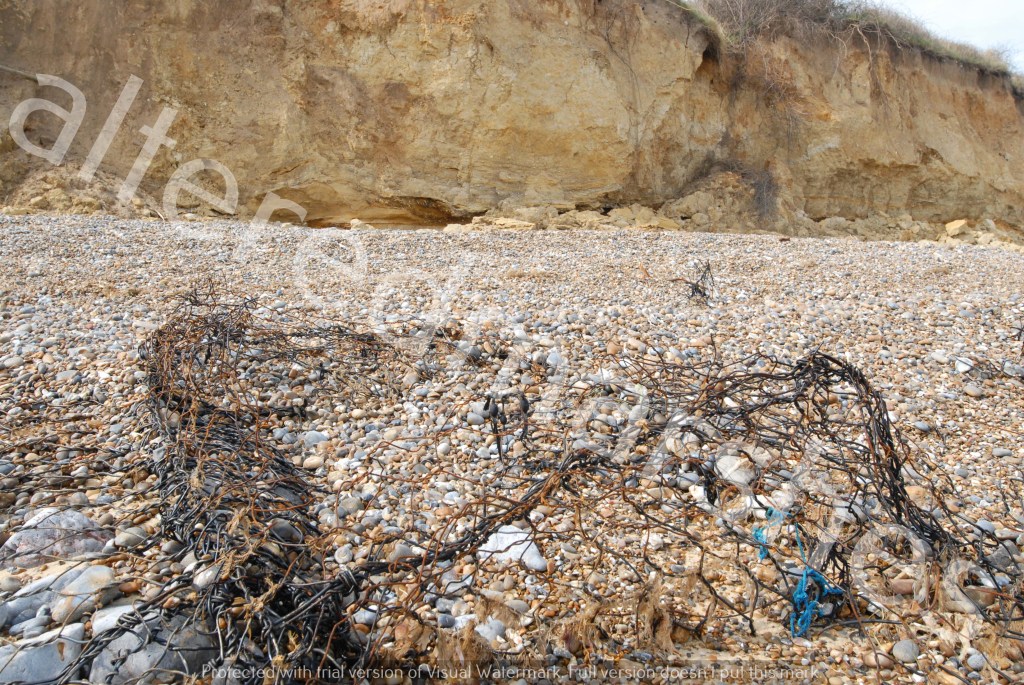
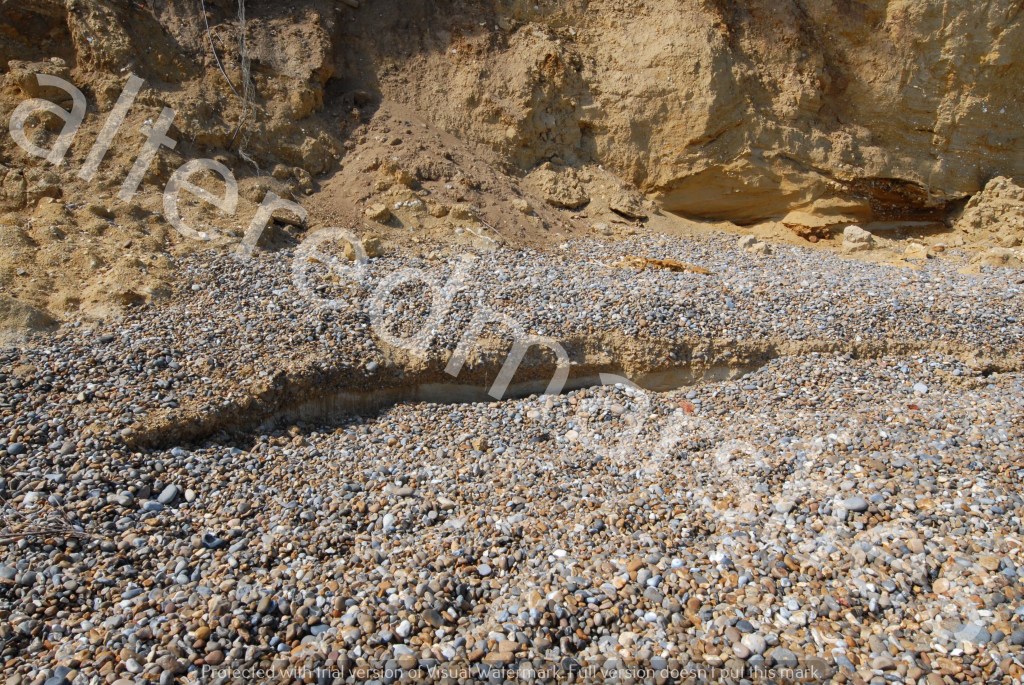
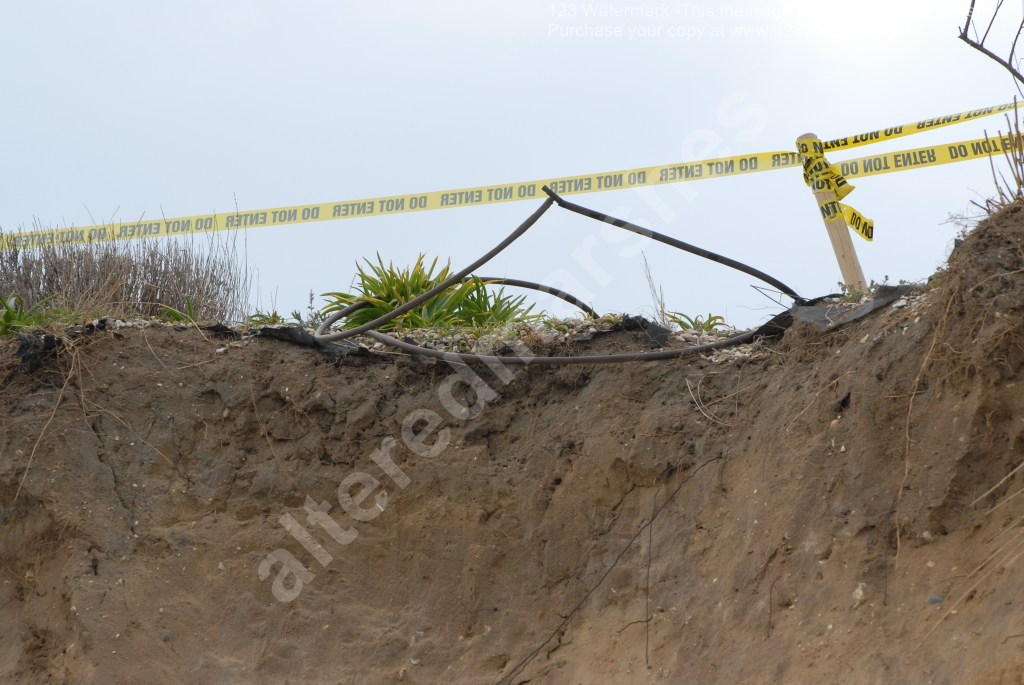
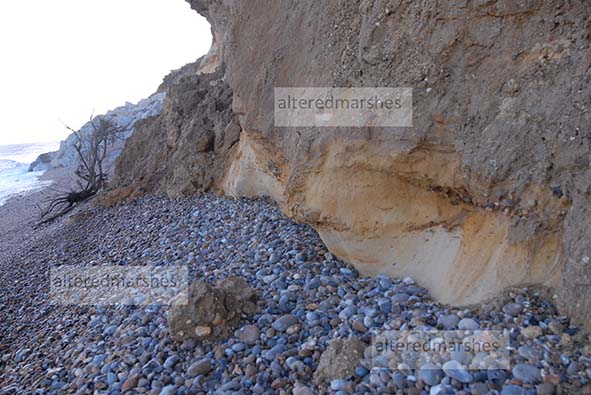
Observing current erosion through the lens of Palimpsest, is also useful as it enables a consideration of recent erosion and how this has affected the cliffs differently. Elevated wave action can scour the base and lower portion of cliff surfaces, stripping the surface and causing sediment to slump onto the beach.

At Thorpeness erosion of the cliff frontage, in the last 5 or 6 months has shifted further up the towards the Ness, at Thorpeness. The surface has been partially stripped of the vegetation and glacial til and fossilised remains and this has left bare sand which has been sculpted by wave action. However, the area of beach that has been spared recent erosion has been freshly eroded by Storms Babet and Ciaran. But because it had been stable for a few months prior to this, the glacial till/fossil sediment is still visible on the surface of the cliff and slumped sediment.

Cliffs showing different stages of erosion. Thorpeness Beach 5th November 2023

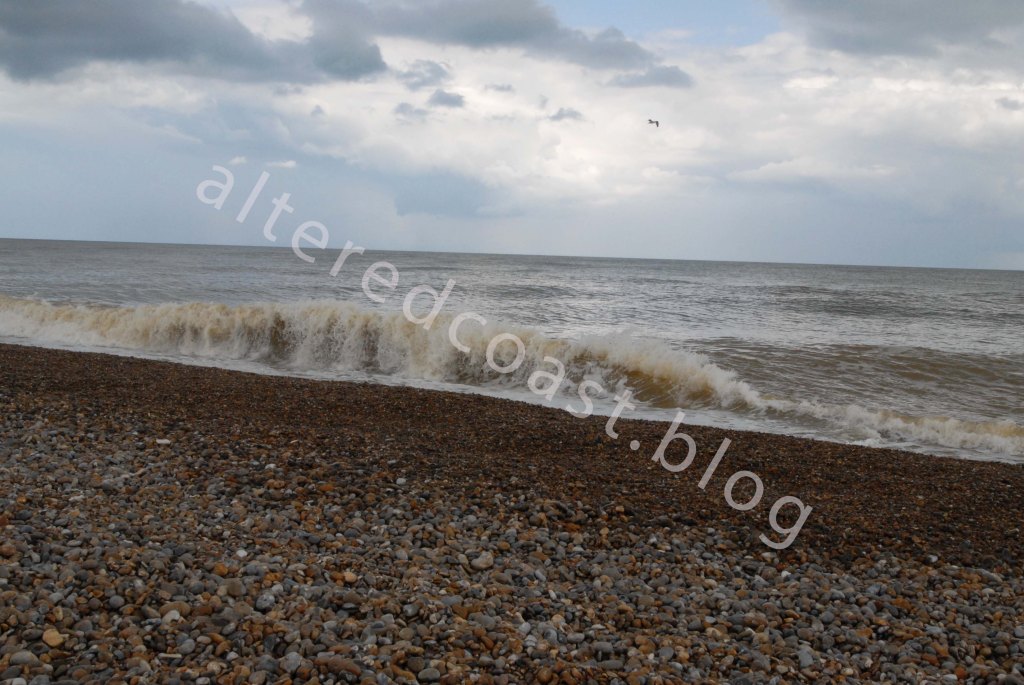
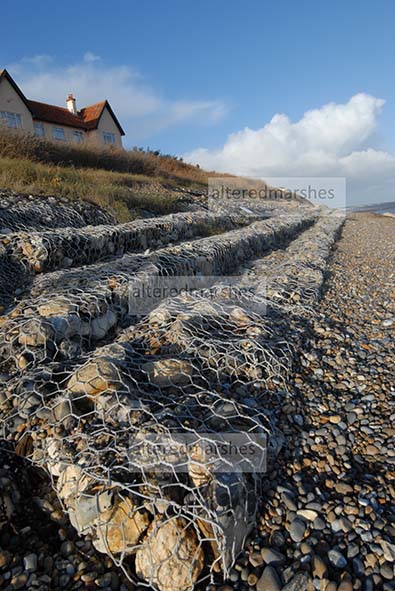
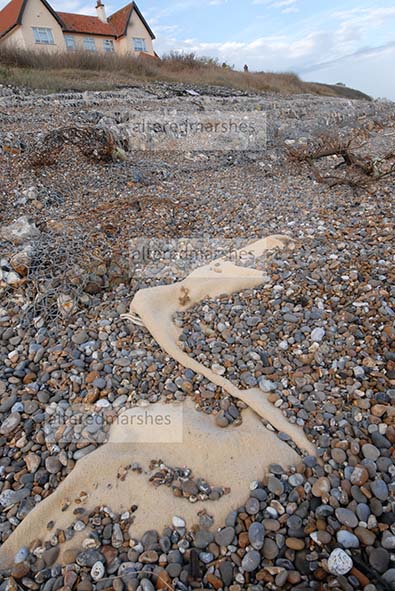
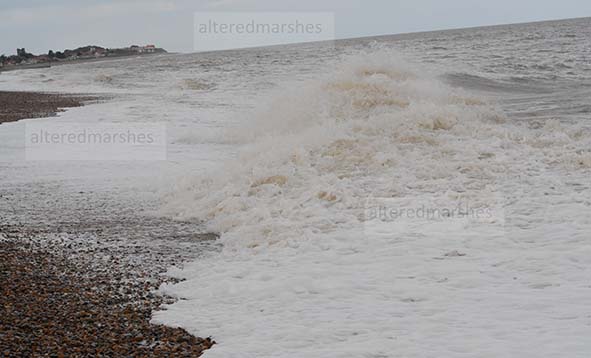
The next location, Sudbourne Beach provides a different setting in which to consider the Palimpsest. It is a high-energy shifting shingle beach, and in such a dynamic area, it is hard to identify threads of current and past coastal change. Recently, the ridge at the back of the beach has flattened with an extensive wide area of shingle showing signs of overtopping with shingle washed by waves into two tongues down to the marshes. The shingle fan stops short of the waterway behind the earthen flood defence that protects the River Alde.

Flattened shingle showing signs of overtopping by the North Sea to marshes behind a previously protective shingle ridge. Remnants of ridge are visible in immediate foreground of photo. 5th November 2023.

On Sudbourne Beach, it could be hard to see the accumulation of coastal features, intrinsically linked over time, it is only possible to see the effects of what Gillian Clarke’s poem, Cantre’r Gwaelod’, describes as the ‘indifferent hunger of the sea’. Whilst it is possible to see the remains of the Shingle Ridge as it was and the smaller shingle ridge that runs the length of the back of the beach, it would seem to be a coastal location that is very much ‘coming into being’. It would be difficult to identify landmarks that provide clues to the trajectory of the coastline.

Long view of remains of shingle ridge with Alde Ore estuary and North Sea. Sudbourne Beach. 5th November 2023.

But perhaps, such locations should be seen as wild places, seascapes governed by natural forces, especially at a time of storms of increasing severity. Use of the approach of the Palimpsest, could provide tools to look through the local, forceful, intense action of Wind-Wave Storms. According to Stoneman, each erosion feature is distinct, but through its characteristics, relates either by its location or by its form to earlier examples. Use of the Palimpsest as a vehicle to see through erosion and sea state to create methods to interpret future marks of the storm.

Shape of a Beach

Erosion of Cliff Face. Thorpeness Beach 11th August 2023

Recent visits to Thorpeness have revealed new erosion features, possibly exacerbated by extreme high waves observed in early July 2023. However, rather than focus on features on the cliffs and beach, this discussion will consider the nearshore processes likely to influence the shape of a beach.

Cliffing erosion into Shingle . Thorpeness Beach 11th August 2023

A local feature known as the Sizewell-Dunwich Sandbank system (SDBs), will be used as a framework to analyse the complex shifting systems that shape and remake this coastline, as no feature remains stable for long. The SDBs are the most enduring feature, but historically they have changed position and size and continue to do so. This section of coastline is a dynamic, fluid environment, with its nearshore characteristics, still unclear beneath the waves. Therefore, this discussion will debate existing analysis of nearshore characteristics, alongside recent photos of erosion and high waves.

High Waves arriving at Thorpeness 5th July 2023

The first system to be considered concerns a model to assess the effects of sediment transport, tidal flows, and wave heights on the SDBs. Regarding sediment transport, Bedload, refers to how sediment is carried by water and bounces along the ocean floor. Suspended Load describes how sediment is picked up and retained within the flow of water. For both methods, it was found tidal flows cause a conjunction of sediment transport, on Sizewell Sandbank. With sediment flowing along the landward side of the sandbank in the tidal flood flow and deviating in a seaward direction to join sediment transported in the tidal ebb moving up from the south.

Along the coastline of Thorpeness, the tidal flood is thought to run in a southward direction, almost parallel to the coast. Tidal currents attain greatest velocity 5 hours before high water, at 0.67 m s-1 on spring tides and 0.31 m s-1 on neap tides. Tidal ebb flows run almost south to north attaining greatest velocities 1 hour after high water, 0.72 m s-1 on spring tides and 0.36 m s-1 on neap tides.

Given the propensity for sediment to travel northwards from Thorpeness, it is interesting to note higher velocities for the south to north ebb flow of the tide. This could be significant if a strong high tide, stirs up significant amounts of sediment on the beach. Particularly as sand from Thorpeness is thought to be transported to offshore sandbanks, whilst shingle is retained on the beach. This relates to beach profile, as larger wave heights can remove fine grain sediment lowering the beach level, whilst shingle is pushed in steep ridges to the upper beach. 

Beach showing the intertidal zone stripped of shingle while ridges are piled up in Supratidal Zone. Thorpeness Beach 11th August 2023

This moves the discussion onto systems of wave action. A study ran model scenarios for different wave heights arriving from a North Easterly direction to assess the impact on the Sizewell Sandbank. In most examples, sediment accumulated on top of the Bank, whereas erosion occurred on the southward side. But in instances involving the biggest waves, the top of the Sandbank also became subject to erosion.

However, on this unstable shifting coast, it is useful to bear in mind that sediment transport can also be heavily influenced by wave direction. Whilst it is thought Thorpeness stands out as an unusual example of Northerly sediment transport on a coastline dominated by Longshore southerly transport. It is also the case that Southerly waves usually result in Northern sediment transport, and Northerly waves usually result in sediment transport in a Southward direction. Wave direction can also be cyclical, with Southerly waves dominating in one season and Northerly in another.   

It has also been thought historically, that Thorpeness retains a layer of resistant Coraline Crag, which underlies the beach geology and stretches out from below North End Avenue towards the ‘Ness’. It is believed this has sustained the headland and the Sizewell Sandbank.

In relation to these points, a disturbed section of water that indicates the presence of Nearshore Sandbanks, can be seen near the location of the promontory of the Ness and Thorpeness Beach.

Line of disturbed water indicating sandbanks. Thorpeness beach. 3rd July 2023

However, a photo taken a few days later in July, shows High Waves, probably caused by a combination of the Supermoon and Storm Poly, with the waves originating from a North Easterly direction. However, it is not possible to identify the line of disturbed water indicating the presence of the sandbanks.

High Waves arriving at Thorpeness Beach. 5th July 2023

But studies have found nearshore sandbanks at Thorpeness can attenuate (lessen) wave energy from NE waves. A study on Wave Refraction also outlines the importance of the sandbanks in reducing wave energy.

Whether the resistant layer of Coraline Crag is still holding firm, recent photos of erosion of the backshore seem to show exposed layers of darker rusty, red lumps of sediment pulled from the cliffs alongside Scarp erosion into the base.

Scarp erosion into cliff face and darker lumps of maybe Norwich or Red Crag exposed. Thorpeness Beach. 11th August 2023

Additionally, recent erosion at Thorpeness, seen in the photo at the top of this discussion, shows erosion seeming at times to shift south to north along the cliff line. With waves arriving at different points on the beach compared to previously.

High Waves on Thorpeness Beach 5th July 2023

There are many contributory factors that can influence erosion features and patterns of wave energy arriving at a beach. A model to assess sediment transport, tides and waves, identified an area of increased Bed Stress in the nearshore at Thorpeness beach. With sections also apparent on the eastern and southern areas of the Sizewell Bank.

Bed Stress refers to abrasion applied by running water on the Seabed. Additionally, Bed shear-stress is created by a combination of waves and currents, that contain disorderly boundary layers that intermingle in a manner in which one element does not automatically follow another. With the water motion described as forceful for beds consisting of sand and gravel. It is also thought the ability of the subtidal platform in the nearshore at Thorpeness to reduce wave energy is lessened and sediment fluidity increases at this location.

Thorpeness sits on an extremely active coastline. With rapidly changing nearshore processes with its bathymetry (profile), interacting with tides and waves to shift and erode sediment. In a high-energy system which can be made more forceful by the powerful influence of weather systems. In a destructive forceful interplay, that leaves its mark, and can forever alter the shape of a beach.

High Waves arriving at Thorpeness Beach. 5th July 2023

“Playthings for the waves of the North Sea”

Shadowlands. Matthew Green

A piece of broken flood defence with notches in the cliff and gouging of cliff surface. Thorpeness 14/04/2022

The penultimate discussion in the series to consider whether large events or small gradual processes contribute the most to coastal erosion, will look at the beach and cliffs of Thorpeness. This area has been subject to gradual long-term erosion, but it is also a dynamic high-energy location where several metres of cliff can be lost in a single storm event. The following features cliff, beach, waves, sand banks, sediment, storms and erosion, will be explored, as they are part of the constant taking apart and altering that occurs at Thorpeness.

To begin with the cliffs, it is useful to consider the geographical make-up, to get a sense of structure. At the top can be seen, glacial deposits of sand, gravel and clays, thought to have been deposited by the Anglian Ice Sheet, around 450,00 years ago. Underneath is a layer of Norwich crag, comprised of marine deposits of fossil shells, bands of yellow and brown sands and clay. The penultimate layer is Red Crag, mostly courser sand and gravel, and this lies on harder Coraline Crag.

Eroded cliffs below Red House, Thorpeness 27/08/2022

The cliff composition gives a picture of how they could be manipulated by waves. Two papers’ Deriving mechanisms and thresholds for cliff retreat in soft-rock cliffs under changing climates: Rapidly retreating cliffs of the Suffolk coast, UK and the Shoreface Dynamics on the Suffolk Coast Marine Research Report find North Easterly winds produce higher waves with greater propensity to scour beaches. Damaging events can occur when NE waves record Significant Wave heights (SWH) that reach or exceed 3.11 metres, as waves of this height have the potential to move substantial amounts of beach material. For example, the event on 31st March 2022 where SWH exceeded 4 metres at Lowestoft caused considerable damage. Storm Surges can produce conditions capable of generating such waves, but they tend to cause damage in different places, in different ways.

Sediment transport is a significant feature at Thorpeness. The paper above to discuss cliff retreat, suggests low-level southerly waves, transport sediment in a northerly direction, possibly nourishing the Sizewell-Dunwich sandbanks. But NE waves scour sediment and transport it in a southerly direction. If we think of erosion as the removing of sediment and the depositing of this sediment at a separate location, then this is the constant process at Thorpeness. This could be why the width of the beach is so narrow, particularly where the most acute erosion occurs. At times the beach appears to be stripped of shingle, whilst at other times, shingle is piled up in ridges at the back of the beach. However, whatever the sediment situation, there appears to be hardly any distance between Mean High Water Spring (MHWS) and the base of the cliff.

View of Thorpeness Beach, with Rock Flood Defence, Shingle Ridges and Red House. 27/08/2022

Features of erosion include notches in the beach and base of the cliff and removal of substantial sections of cliff frontage. There is considerable slumping of debris from the top and the bottom of the cliff deposited on the beach, along with trees, turf and concrete slabs from gardens above.  

Each feature discussed above contains complex properties that interact and evolve on this coastline. High wave events could weaken cliffs and cause cliff retreat, in the years that follow storm events. But perhaps it is too simplistic to identify large erosion events as the cause of erosion. Fragile composition of the cliffs could mean they will inevitably erode over time. The beach constantly changes, when shingle accretes, this could mitigate erosion.

Notches in the beach and base of the cliff, Thorpeness. 27/08/2022

New notching into the beach, widening of notching at the cliff base and new desiccation cracks in August 2022, occurred during summer months when very few storm conditions were recorded.

Desiccation Cracks in Cliffs at Thorpeness. 27/08/2022

But it is the severity of the erosion during high wave events and the significant way they change the cliffs and beach, that suggest these events contribute most to coastal erosion. Particularly as they make mechanisms of recovery hard to envisage at Thorpeness. Complexity of the erosion and the characteristics and frequency of high wave events set the scene for the playthings of the North Sea.

Wind Waves Cliff

In a brief continuation of the previous discussion about high waves and the effect on the coastline, photos below show the current state of the cliffs at Thorpeness, as they were on 14th April 2022.

Multiple slippages can be seen from the cliff frontage, with the surface slumping and collapsing down to the beach at the base of the cliff.

Exposed and collapsed cliff frontage Thorpeness Beach

There also seems to be evidence of carving or gouging, with large indents into the surface of the cliff.

Scouring and carving into surface of cliffs, Thorpeness beach

Pillars and holes seem to have been created by the erosive forces that are reshaping these cliffs.

Profile of the cliff with signs of surface slumping, scouring and pillars created by wave energy

Residents living in properties near the edge of the cliff are managing the rapid erosion as best they can and have added tape at the end of their gardens that say Do Not Enter.

Tape added at top of cliffs, Thorpeness Beach

But the forces, altering and scouring out these cliffs contain an energy that is hard to predict and restrain.

“The winds of a thousand miles buffeted and blew, wind over tide, wave over beach, the whole force of accumulated energy finally crashing up against our cliff” Easternmost House, Juliet Blaxland.

Photo of Thorpeness Cliff, taken on 4th April 2022 by artist and Thorpeness resident Carol Cameron.

This post uses a combination of mediums to discuss a period of high waves at the chosen locations of Lowestoft and Felixstowe on 31st March/1st April 2022. To begin, we have text that describes the image of storm waves hitting a cliff near Benacre in Suffolk, and above, a photo showing Thorpeness cliff a few days after the high wave period.

The juxtaposition of the two mediums isn’t intended to prove a causal link between the two, but is intended to discuss a category on CoastalMonitoring.org, which states Significant Wave Heights (SWHs) that reach a certain height in metres, are deemed to have met the Storm Alert Threshold. Waves that reach this height are predicted to have a return period of around four times a year and are of interest because they have the potential to move significant amounts of beach material. At Lowestoft the Storm Alert Threshold SWH is 3.11 metres and at Felixstowe, it is 1.94 metres.

Another useful mechanism is to analyse wave height data. The source of all the data in this post is coastalmonitoring.org and the data is obtained from a Datawell Directional WaveRider Mk III buoy, owned by the Environment Agency. At Lowestoft the buoy was first deployed on 20th April 2016, and at Felixstowe, the buoy was deployed on 4th September 2012. For an explanation of the measure of Significant Wave Height, a post on this blog High Waves in October, provides more detailed information.

Waves hitting Boulder Flood Defences, Aldeburgh beach November 21st 2022

On the 31st of March and 1st April, the highest SWH for 2022 was recorded. As a comparison, the table below compares figures at Lowestoft and Felixstowe for 2021 and 2022.

Source of data, coastalmonitoring.org, obtained from Datawell Directional WaveRider Mk III buoys, deployed by the Envrionment Agency

The chart shows the highest Significant Wave Height in feet and metres. This enables a comparison with height in feet and the Ts Peak, which refers to the wave period where the highest wave energy is centred. It is believed when height in feet roughly matches Ts Peak, this indicates storm conditions. The figures for 31st March 2022 at Lowestoft, are more closely aligned, than those for 2021, but of most interest, are the figures for Felixstowe in 2021 and 2022, which pretty much match each other for height in feet and Ts Peak figure. The figures for wave height in metres, allow for a comparison with Wave Power, which is a measure added in 2022. Wave Power refers to the rate of transfer of energy through each metre of wave front.

This discussion intended use several mediums to consider the high wave period at the end of March/beginning of April. To add physical visualisation to this consideration, the photo at the top of this post, taken at Thorpeness beach, seems to show that the cliff has been gouged out with more trees lost over the cliff. Additionally, the East Anglian Daily Times describes how at Felixstowe, 25 beach huts were picked up by the sea and smashed together on the sea front on 1st April 2022.

The news report attributes high tides to the damage at the sea front, however, in this case, factors described later on in the article, namely strong north-easterly winds, were the main contributor to the coastal damage at the end of March/beginning of April. Interestingly, North-easterly winds are known to scour beaches, and observers of beaches around Sizewell and Covehithe who have experienced a loss of sand and shingle in recent months, might note that the East Anglian Times article, describes how up to 5 inches of sand and shingle were deposited on the sea front at Felixstowe.

The high wave episode discussed in this post occurred in a period in 2022 of exceptionally high tides and waves which have had a serious impact on coasts and estuaries. Future posts will continue to use a combination of mediums to discuss the wind on the waves in Suffolk.

Storm Beach

As high winter waves on the Suffolk coast continue to be recorded at Lowestoft, with Storm Barra, on the 7th December, seeing a maximum wave height (MWH) of 6 metres with a significant wave height (SWH) of 3.37 metres. This discussion will consider the definition that a SWH of 3.11 metres or above, with a return period of four times a year, has the potential to move significant amount of beach material.  Wave data is from Coastal Monitoring.org.

As a focus for a discussion of what it means for storm waves to move significant amounts of beach material, a beach near Thorpeness, that has undergone considerable erosion in recent years will be considered. An emergency flood defence, in the form of a 35-metre rock revetment was installed in October 2021 at the northern end of Thorpeness beach in a partnership between Coastal Partnership East (CPE) and the Water Management Alliance. CPE believe Thorpeness experienced “more intense levels of coastal erosion” last winter and this prompted the emergency response.

A 35-metre Rock Revetment installed at northern end of Thorpeness beach in Suffolk. Photo taken January 1st 2022.

A number of flood defences have been constructed, over the years at this section of beach including wire-filled gabion baskets installed in the 1970s, and geotextile bags and small rocks installed in May 2021 as a short-term solution. However, recent powerful storms have demonstrated just what a hard job coastal flood authorities face, to manage ongoing erosion. Photos taken less than 6 weeks apart show significant damage to the bags and rock cages. Firstly, a photo taken on November 21st 2021, shows the intact bags and cages.

Rock cages on Thorpeness Beach, November 21st 2021

Whilst a photo taken on January 1st 2022, shows the damage caused by storm waves to the flood defences.

Rock Cages and Bags showing storm damage on Thorpeness Beach, January 01 2022

Secondly, at the area of beach, subject to the most severe erosion, a photo taken on November 21st 2021, shows scouring at the base of cliffs.

Scouring at the base of cliff on Thorpeness beach, November 21st 2021

A subsequent photo shows how a vertical landslip down the face of the cliff, has caused a large square piece of concrete to fall from the top of the cliff. Descriptions of erosion processes do say that scouring at the base of a cliff can ultimately lead to a land slip of the cliff above, but in this specific case, it is not possible to establish a causal link.

A landslip that has caused a large piece of concrete to fall from the cliffs on Thorpeness Beach, January 1st 2022.

Thirdly, two photos give a wider view of houses at the top of the cliff with a view to the newly installed flood defences.

View of Thorpeness beach with houses at top of cliffs, newly installed flood defences and Aldeburgh Martello Tower, November 21st 2021.
View of Thorpeness Beach with houses on top of cliff, recently installed flood defences and Martello Tower in background, January 1st 2022

The later photo above seems to show how erosion has stripped back the surfaces at the base of the cliff. It is also interesting to note how much shingle has been removed from the beach and how much the remaining ridge of shingle has been pushed back up the beach.

Damaged flood defences on Thorpeness beach with view of how far remaining shingle ridge has been pushed up the beach, January 1st 2022.

Future discussions will consider the history of flood defence approaches on this dynamic stretch of coastline, and examine the erosion processes that continue to alter beaches and cliffs.

High October Waves

As the coast enters the winter storm season, it is useful to analyse wave patterns on the Suffolk coast and consider recent incidences of considerable wave height. The location of the wave measurements is Lowestoft, where wave data is monitored using a Datawell Directional WaveRider Mk III buoy. The buoy is owned by the Environment Agency, and it was first deployed on 20th April 2016. The source of the data is coastalmonitoring.org.

Waves breaking on the beach at Orford Ness, Suffolk

Consideration of wave data will focus on significant wave height (SWH), defined as the average height of highest one-third of all waves measured. SWH will be considered in relation to maximum wave height (MWH), the highest wave within a wave measuring period. SWH and MWH for the month of October 2021 will be analysed alongside the dominant wave period (DWP), the Tpeak (seconds). This refers to the wave period where the highest wave energy is centred and observing DWP can enable analysis of whether a wave is a product of local winds, or a product of a swell. If the DWP and wave height roughly match each other, this can indicate storm conditions.

Waves and Spray, Orford Ness, Suffolk

The charts which record wave height data on coastalmonitoring.org, have a red line which runs horizontally, which indicates the storm alert threshold. SWHs above this line can be considered to be a product of storm conditions. Additionally, these waves can be analysed in relation to their return period, whether are relatively common, with a likely return period of four times a year, or whether the SWH has a return period of every 50 years, or a hundred years. The chart on coastalmonitoring.org, for Lowestoft, has a storm alert threshold height of 3.11 metres, with a return period of four times a year. To analyse SWH and MWH in more detail, data from 2nd October 2021 will be considered. On this date, a SWH of 3.64 metres and a MWH of 6.83 metres were recorded.

Wave Height Data from Lowestoft recorded by the Datawell Directional WaveRider Mk III buoy, owned by the Environment Agency. Source of data, coastalmonitoring.org

For the purposes of analysing the high wave data on 2nd October in relation to the Dominant Wave period (DWP), the SWH in metres will be converted into feet. Therefore, on this date, the SWH was 12 ft and the DWP, T-Peak (S), was 8.3 seconds. However, to determine the extent of storm conditions it is useful look at the wave measurements before and after the highest SWH.

Wave Height and T-Peak (S) data from Lowestoft recorded by the Datawell Directional WaveRider Mk III buoy, owned by the Environment Agency. Source of data, coastalmonitoring.org

It is interesting to note that the figures for the DWP are very near the height in feet of the SWH. It is acknowledged that when the figures correspond in this way, it is indicative of storm conditions. This would also suggest that waves were forming in a wind-wave environment. As can be seen from the chart showing the SWH and the MWH, the increase in the SWH rises as the MWH reaches its peak. Though the highest SWH was recorded just after the measurement for the highest MWH.

The MWH of 6.83 metres (22 ft) was the highest MWH recorded in October 2021, though MWHs of 6.13 m (20 ft) and 5 m (16 ft) were recorded on 31st October 2021. Though the highest SWH on this date only reached 2.92 metres (10 ft). Instances of MWH over 5 metres are clearly concerning, particularly, if they show signs of an increase from what has been previously recorded for a particular time period. However, the MWH is the height of individual peak waves, whilst SWH is the average height of the highest one-third of all waves measured. As this can be considerably lower than the MWH in any period, the SWH is of interest to coastal engineers, because the storm alert threshold for SWH has a return period of four times a year. Therefore, if the SWH is above this threshold, it could indicate the presence of waves capable of moving potentially significant amount of beach material.

A future discussion will consider this point in more detail by examining a stretch of coast at Thorpeness, in Suffolk which is currently experiencing severe beach erosion, which poses a danger to houses stationed very close to the edge of the eroding cliffs.

Waves breaking on Aldeburgh beach, with Thorpeness in background.