“The winds of a thousand miles buffeted and blew, wind over tide, wave over beach, the whole force of accumulated energy finally crashing up against our cliff” Easternmost House, Juliet Blaxland.

Photo of Thorpeness Cliff, taken on 4th April 2022 by artist and Thorpeness resident Carol Cameron.

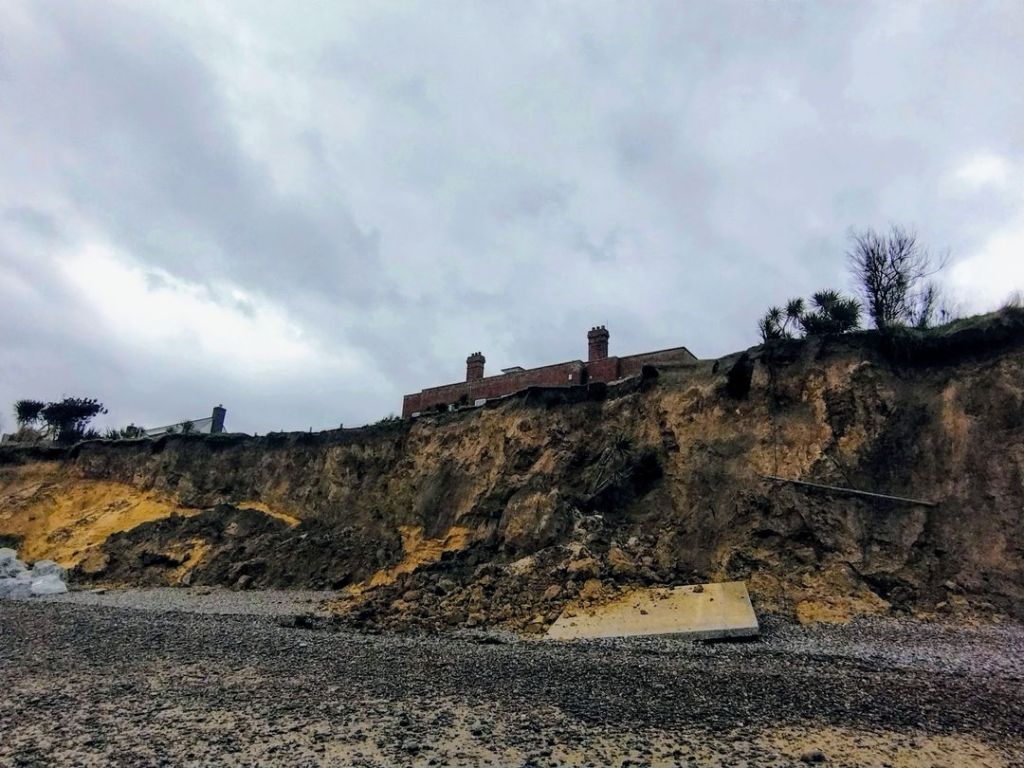
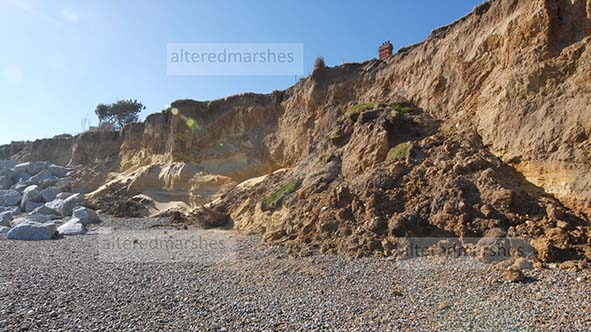
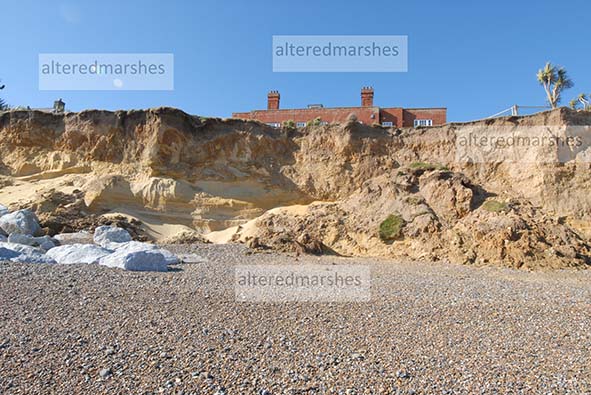
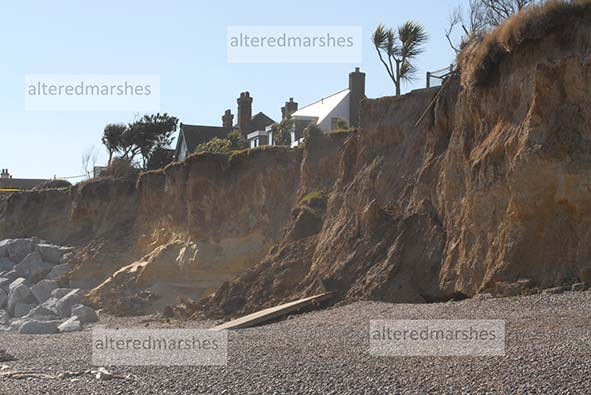
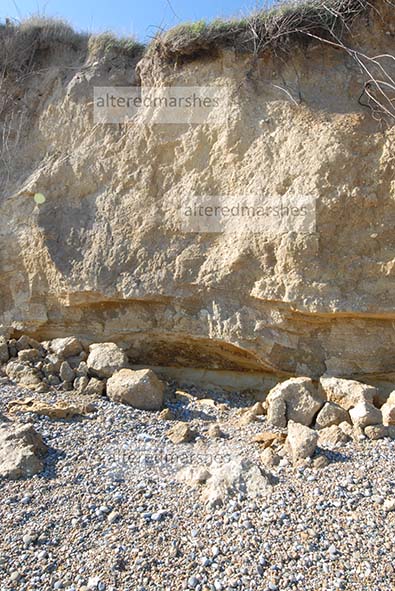
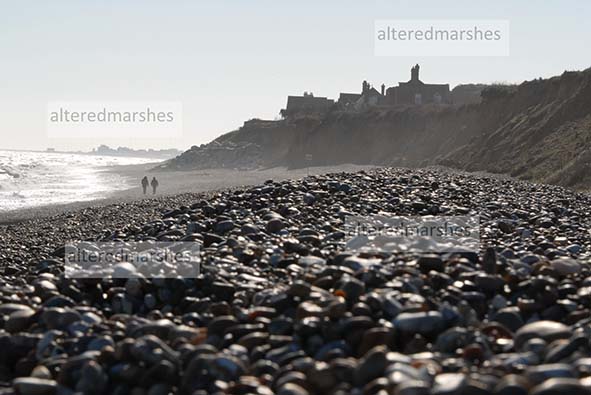
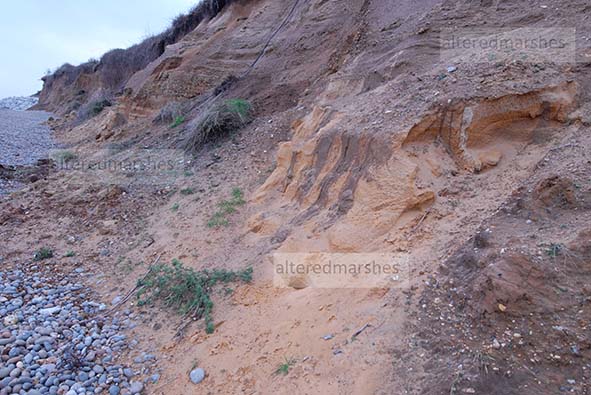
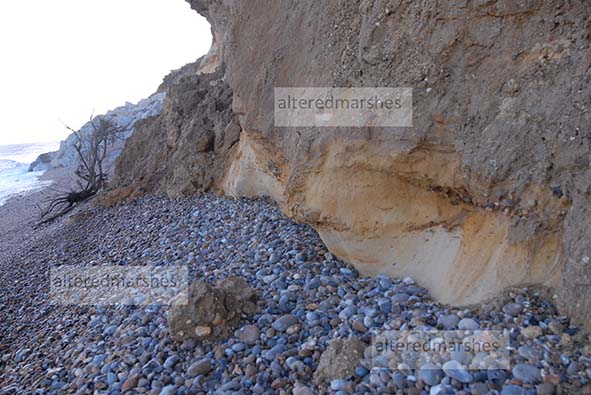
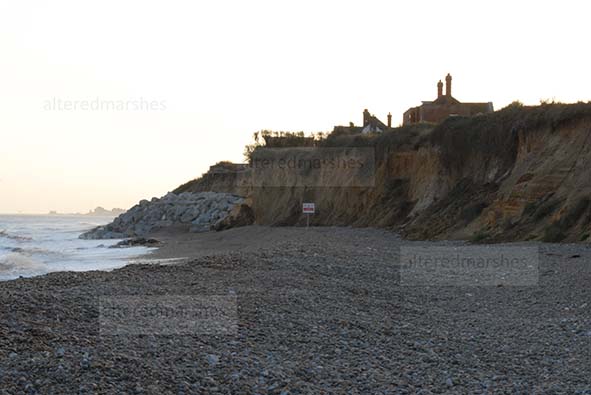
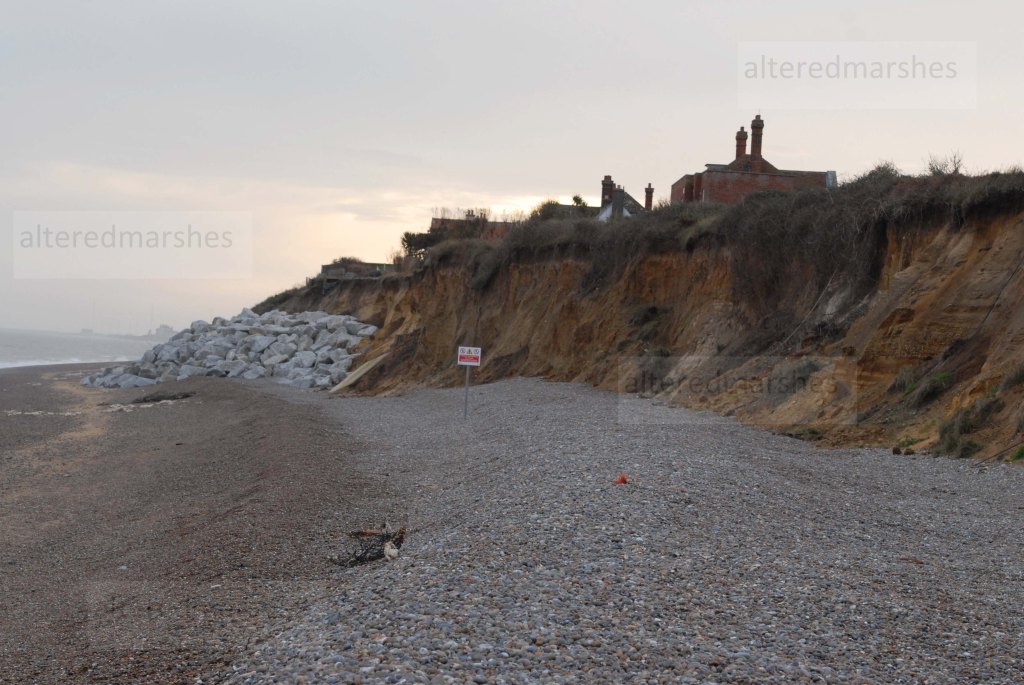
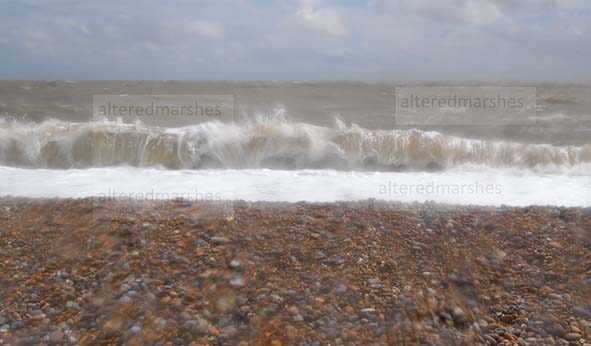
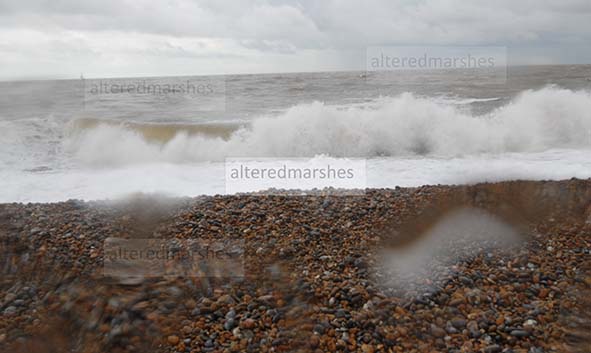
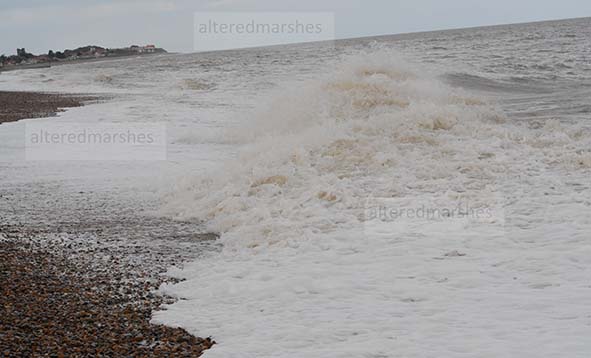
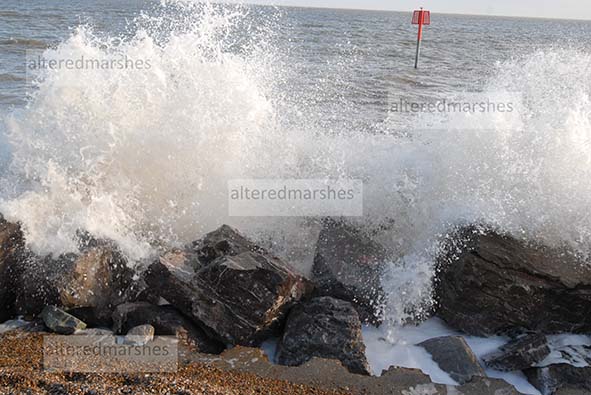
This post uses a combination of mediums to discuss a period of high waves at the chosen locations of Lowestoft and Felixstowe on 31st March/1st April 2022. To begin, we have text that describes the image of storm waves hitting a cliff near Benacre in Suffolk, and above, a photo showing Thorpeness cliff a few days after the high wave period.

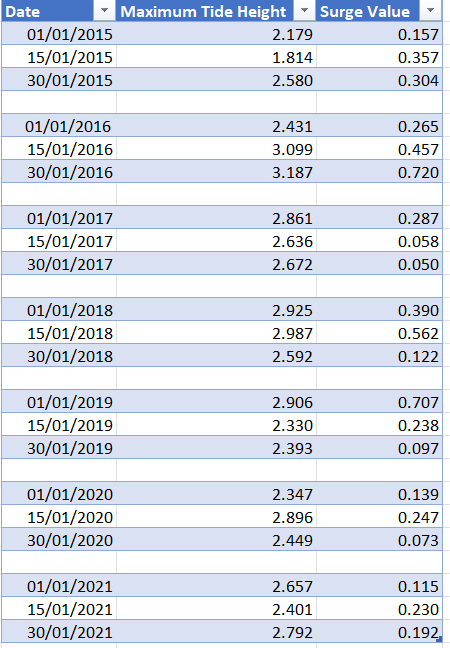
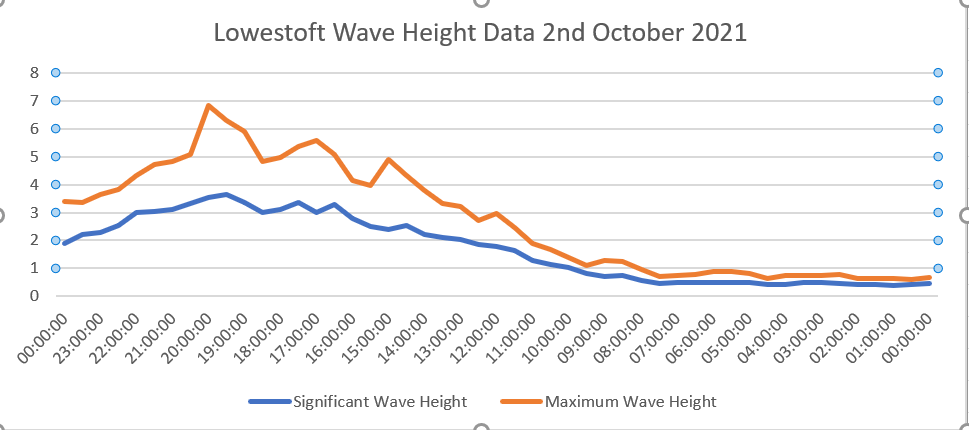
The juxtaposition of the two mediums isn’t intended to prove a causal link between the two, but is intended to discuss a category on CoastalMonitoring.org, which states Significant Wave Heights (SWHs) that reach a certain height in metres, are deemed to have met the Storm Alert Threshold. Waves that reach this height are predicted to have a return period of around four times a year and are of interest because they have the potential to move significant amounts of beach material. At Lowestoft the Storm Alert Threshold SWH is 3.11 metres and at Felixstowe, it is 1.94 metres.

Another useful mechanism is to analyse wave height data. The source of all the data in this post is coastalmonitoring.org and the data is obtained from a Datawell Directional WaveRider Mk III buoy, owned by the Environment Agency. At Lowestoft the buoy was first deployed on 20th April 2016, and at Felixstowe, the buoy was deployed on 4th September 2012. For an explanation of the measure of Significant Wave Height, a post on this blog High Waves in October, provides more detailed information.

Waves hitting Boulder Flood Defences, Aldeburgh beach November 21st 2022

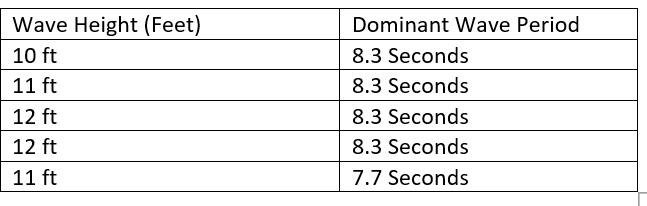
On the 31st of March and 1st April, the highest SWH for 2022 was recorded. As a comparison, the table below compares figures at Lowestoft and Felixstowe for 2021 and 2022.

Source of data, coastalmonitoring.org, obtained from Datawell Directional WaveRider Mk III buoys, deployed by the Envrionment Agency

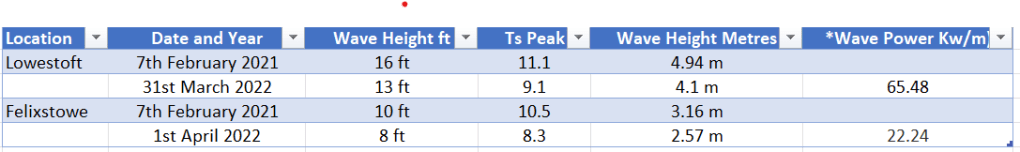
The chart shows the highest Significant Wave Height in feet and metres. This enables a comparison with height in feet and the Ts Peak, which refers to the wave period where the highest wave energy is centred. It is believed when height in feet roughly matches Ts Peak, this indicates storm conditions. The figures for 31st March 2022 at Lowestoft, are more closely aligned, than those for 2021, but of most interest, are the figures for Felixstowe in 2021 and 2022, which pretty much match each other for height in feet and Ts Peak figure. The figures for wave height in metres, allow for a comparison with Wave Power, which is a measure added in 2022. Wave Power refers to the rate of transfer of energy through each metre of wave front.

This discussion intended use several mediums to consider the high wave period at the end of March/beginning of April. To add physical visualisation to this consideration, the photo at the top of this post, taken at Thorpeness beach, seems to show that the cliff has been gouged out with more trees lost over the cliff. Additionally, the East Anglian Daily Times describes how at Felixstowe, 25 beach huts were picked up by the sea and smashed together on the sea front on 1st April 2022.

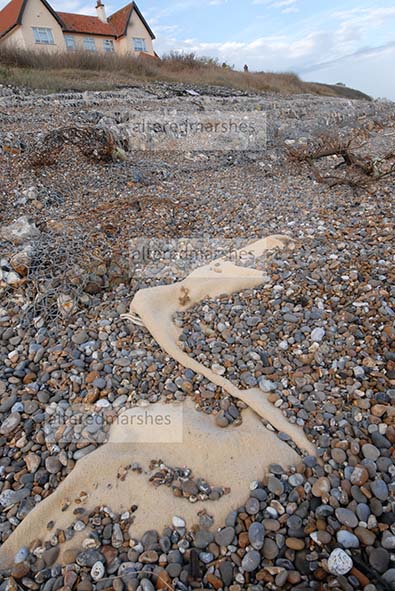
The news report attributes high tides to the damage at the sea front, however, in this case, factors described later on in the article, namely strong north-easterly winds, were the main contributor to the coastal damage at the end of March/beginning of April. Interestingly, North-easterly winds are known to scour beaches, and observers of beaches around Sizewell and Covehithe who have experienced a loss of sand and shingle in recent months, might note that the East Anglian Times article, describes how up to 5 inches of sand and shingle were deposited on the sea front at Felixstowe.

The high wave episode discussed in this post occurred in a period in 2022 of exceptionally high tides and waves which have had a serious impact on coasts and estuaries. Future posts will continue to use a combination of mediums to discuss the wind on the waves in Suffolk.

Latest erosion at Thorpeness.

A video taken by local resident and artist Carol Cameron shows a major land slip off a cliff face at Thorpeness. The interesting thing to note is that prior to the land slip, significant scouring, due to wave action, had occurred at the base of the cliff. The subsequent fall of material from the frontage of the cliff can be seen in the video.

Sand and Shingle

Land slips, exposed sand and flood defence rock revetment, Thorpeness beach

Severe erosion continues at Thorpeness beach, particularly on the section of beach below North End Avenue. The most noticeable features include substantial damage to flood defences, a loss of material and retreat of the cliff face, scouring at the base of the cliffs and a significant loss of shingle.

Flood defences have been in place on the beach frontage, 250m south of Red House, since the 1970’s in an attempt to repel the destructive wave energy directed at this section of beach. At the beginning of the year, there was evidence of scouring around the edge of rock cages installed as flood defences and in some places, the cages had been pulled apart. However, recently with a loss of shingle in front of the defences, they have lost their solidity, with big gaps where there used to be firm continuous defences.

Rock cage flood defences showing signs of damage on Thorpeness Beach

The effects of sculpting by wave action, leading to sand drifting from the cliff face, is a contributory factor to loss of material from the cliff frontage below Red House. In addition, land slips from the cliff face regularly occur. In the photo below, patches of turf, possibly from gardens above can be seen following a recent fall of cliff material.

Cliff frontage showing signs of erosion with Red House on North End Avenue set back from the cliff

The retreat of the cliff line reveals the increasingly perilous position of several significant properties positioned on North End Avenue, near the top of the cliffs.

Properties on North End Avenue with cliffs displaying signs of erosion, Thorpeness Beach

Scouring at the base of the cliffs, is also quite extensive. This could weaken the cliffs further, potentially leading to further falls along the cliff frontage.

Signs of scouring at the base of the cliff face, Thorpeness Beach

This vulnerability is exacerbated by the apparent stripping away of shingle from the beach. Thus removing any feature that could dissipate the energy of the waves before it hits the cliffs. A longer view down the beach from a ridge of shingle shows the erosion of the cliff frontage, the houses on North End Avenue and the recently installed rock revetment flood defence, with the Aldeburgh coastline in the background.

Ridge of shingle on Thorpeness Beach with eroded cliffs and Red House in background

As was discussed in the post Elements of Erosion, the shifting of shingle, both off and around the beach, isn’t the only erosive process occurring at Thorpeness.  But the wider question of sediment transport is a significant process driving the erosion of this section of coastline. The mechanisms and features driving this process iswill be considered in future discussions.

Lowestoft High Tides 2015 – 2022

On 29th January 2022 a weather system, named by the Danish Meteorological Institute as Storm Malik, brought significant winds to the UK. The storm passed to the North-East of the UK and generated a large storm surge on 30th January 2022, which travelled down the east coast and had considerable impact at several locations on the East Anglian coast.

The surge occurred on a Neap Tide but it still raised sea levels at Cromer in (Norfolk) to the highest elevation recorded for 2022, with a Skew Surge of 1.4 m recorded. Similarly, at Lowestoft a skew surge of 1.3 m was logged. Furthermore, the storm surge travelled up the River Waveney from Great Yarmouth causing severe damage at Haddiscoe cut railway embankment and Carlton Marshes.

Additionally, at Slaughden, Aldeburgh in Suffolk, the surge arrived at the Alde and Ore Estuary around two hours before the usual High Tide. At Slaughden, there is a fairly narrow strip of shingle and compacted tarmac and track in-between the open coast and the Alde and Ore Estuary. Several boat yards and the Aldeburgh Yacht Club have premises at Slaughden that face out onto the Alde and Ore Estuary.

On 30th January 2022, high water was observed to be almost at the top of the sea wall on the estuary side and the open coast at Slaughden at the same time. Usually, the tide on the open coast would ebb away around 2 hours before High Tide is due on the Alde and Ore Estuary. High water remained at the same level at the top of the sea wall on both river and open coast for around 2 hours, before it ebbed as it would normally on the Alde and Ore estuary. On the open coast, at times the sea was estimated to be near the highest level observed to date on the beach side at Slaughden.

To consider the question of observed high water levels in more detail, it was decided to study data for three specific dates, the 1st, 15th and 30th for the month of January 2015-2022. Data was obtained from the British Oceanography Data Centre, from the Port, P024 at the site of Lowestoft, with the Latitude of 52.47300 and Longitude of 1.75083 with the start date of 01JAN2015-00.00.00 and end date of 23:45:00 for each year analysed. For data analysed in July, the start date was 2015/07/01 00:00:00 and the end time was 23:45:00 for each year analysed. The Contributor was the National Oceanography Centre; Liverpool and the data refers to Admiralty Chart Datum (ACD).

Data showing the maximum observed tide level for the dates of 1st, 15th and 30th for the time period of January 1st 2015 to 30th January 2022 can be seen displayed in the chart below.

Chart showing Maximum Wave Heights at Lowestoft for 2015 – 2022. Data from British Oceanographic Data Centre

However, to get a better perspective, on the significance of each observed tide height, it is possible to examine whether the tide figures were within predicted heights, or heightened by surges. To do this, the Tidal Residuals, (the measured height minus the predicted height of the tide) can be considered for the tide heights measured in the charts above. Predicted values are derived from a database of tidal constants maintained by the National Oceanography Centre Application Group. All values are relative to Admiralty Chart Datum (ACD). Data is from the British Oceanography Data Centre.

The data in the tables below, shows information for three specific dates, the 1st, 15th and 30th of January 2022. Though it should be borne in mind, that tides could be elevated due to Spring Tides.

Additionally, data in the table below shows the Observed High Water levels and Tide Residuals for January 2015 – 2021.

Data from the British Oceanography Data Centre.

The data in the tables above, shows maximum observed tide levels along with the tide residual figures. These can show whether tide heights correspond with predicted tide levels or whether they indicate a large deviation from predicted tide heights. The lowest tide residual figures show the closest correlation with predicted tide heights and the largest show the greatest deviation. So, on the 15th of January 2017 the Tide height was 2.636 and the Tide Residual figure was 0.058, whereas on 15th January 2018 the Tide Height was 2.987 and the Tide Residual figure was 0.562.

Data showing maximum tide levels and tidal surges gives us a simple insight into tidal conditions for the months and years analysed above. The figures can serve as a useful initial indicator but further analysis is needed to account for weather conditions or the monthly astronomical Spring Tides, which can contribute to elevated sea levels.

However, these figures could contribute to consideration of the possible effects of high water levels such as those experienced in January 2022 on rivers and infrastructure in coastal locations.

High Tides

At the time of writing on the evening of February 9th 2022 there are flood alerts issued again for the tidal River Yare, from Thorpe St Andrew to Breydon Water and the tidal River Waveney from Ellingham to Breydon Water. This area is of interest because the alert mentions a heightened risk at the Haddiscoe New Cut, which has its embankment reduced. Emergency repair work is currently being undertaken following the incident on January 30th when a Greater Anglia train was halted as a section of railway embankment was washed away.

A dramatic video from Greater Anglia news shows the severity of the damage to the track at Haddiscoe. What is interesting about the video is that the flood water appears to be gushing below the railway line in a massive breach underneath the track. The water also appears to be flowing from holes in the bank of the river underneath the vegetation presumably separating the track from the river. This could possibly be as a result of a process known as Dessicated Cracking, when flood water exploits cracks in riverbanks or flood defences to seep through to force slippages or breaches in clay earthen structures.

Flooding in this area is also of concern to Carlton Marshes nature reserve as on the same morning as the Haddiscoe incident, there was also a sizeable breach in flood defences at Carlton Marshes at the White Cast reedbed. The area of the reserve affected remains vulnerable to further breaches from high tides as it awaits repairs. At Carlton marshes, the inundation occurred at the end of a month of lower-than-average-rainfall. So on 30th January the flooding was the result of high tides and not heavy rainfall. This is of concern because certain habitats on coastal marshes are freshwater only, and a surge of tidal salt water can cause irreparable damage to wildlife reserves.

The new year has witnessed a series of high tides, the usual reasons including Spring Tides combined with heavy rainfall at the start of January and February and the effects of Storm Malik and Storm Corrie. However, flood warnings and alerts have been consistently and regularly issued, with coastal towns and villages experiencing flooding of town centres and coastal frontages with high waves testing the resilience of flood defences. One contributory factor to the flooding on the River Waveney concerns a process known as the natural tide locking effect. High tidal waters moving up the rivers from Great Yarmouth restrict drainage out to sea at low tide.

Future consideration of this discussion will look at the question whether recent events suggest a change in the behaviour of coastal tides. Whether the New Year winter flooding is simply a result of winter conditions or does it signify a departure in usual tide levels seen at this time of year.

Elements of Erosion

This discussion will consider three particular elements to the on-going dramatic erosion at Thorpeness.

Cliff face showing signs of being shaped by action of waves, Thorpeness beach.

The first element is the flood defences installed in a series of attempts to hold back the sea. A Gabion defence, a stone filled mesh box was installed in 1976, following serious erosion with beach material added to cover the defence. However, storms in 2010 exposed this defence, so Geobags were installed at the bottom of the Gabion defence, but these in turn were seriously damaged in storms in 2013/14. Small rocks were then placed around damaged defences as a short-term measure in May 2021. In October of this year, a 35-metre rock revetment was installed below the fastest eroding section of cliff to protect property above.

Scouring at base of Flood Defence, Thorpeness beach

The second element is a cairn made up of pieces of Coraline Crag that seems to symbolise what is solid and permanent and fragile and temporary at Thorpeness. A detailed report by Mott Macdonald outlines the geographical features that shape the beach morphology at Thorpeness. The Coraline Crag pieces have broken off a series of ridges that extend North-East from the end of North End Avenue. Historically, these ridges have been largely resistant to erosion. Another significant feature, the Sizewell Dunwich Bank Complex (SDBC) connects to a headland at Thorpeness, through the Coraline Crag ridges. The SDBC is sometimes extending towards Thorpeness with sediment from sources to the north accreting on the Ness, with beaches to the south starved of sediment. Sand may also move offshore from Thorpeness to the southern end of the SDBC.

Piece of Coraline Crag & Driftwood, Thorpness Beach

This relationship is made more complex by observations of a shifting offshore bank which could focus wave energy onto North End Avenue, where erosion is particularly acute. Beach lowering, caused by sediment removal, could enable storm waves to reach the base of the cliff. This concurs with research by Earlie, Masselink and Russell from the Universities of Cardiff and Plymouth who compared contrasting beaches in Cornwall and found even though erosion was more constant at a beach, with a gentle foreshore, the beach with a steeper foreshore, saw massive erosion, when Mean High Water of a Spring Tide combined with a storm surge.

Wave energy can be reflected offshore by sand banks or defence structures and interact with an incident wave field. Constructive wave interference could see the crest or trough of a wave moving through or overlaying the crest or trough of another wave. This could heighten waves and drive sea floor currents and generate wave turbulence, which could drag additional sediment and hold it for longer, so even a weak current moving alongshore could remove beach sediment in larger quantities, than would be the case, were wave reflection to be absent. This lowers the beach further enabling larger waves to reach the shoreline driving further sediment loss. Notably, a future for Thorpeness state in the 6 months to August 2021, 10m of cliff were lost at the North end of the village in New Year storms.

Erosion at base of Cliff, Thorpeness Beach

The third element is the erosive forces themselves, in particular, Abrasion and Hydraulic action. Abrasion describes how bits of sand or rock in waves can grind down cliff surfaces like sandpaper, with boulders projected like strong hammers, pebbles like bullets and sand like abrasive powder.

Scouring into cliff face, Thorpeness Beach

Regarding Hydraulic Action, waves propel air in advance of them and squeeze it against the cliff face. When the air is freed, it inflates with considerable force, destabilising and tearing away part of the cliff. In a connected process, Desiccated Cracking, the combined attrition of the weather and action of waves, can weaken a cliff face. Alternate heating and cooling cause the body of the cliff to expand and contract, creating cracks in which rain and sea water seep into crevices. When water freezes it expands massively, loosening segments of cliff face, additionally, when a cliff surface, dries and hardens, cracks can widen and deepen. Hydraulic actions, dampening and drying can cause large slippages of whole sections of sand and clay in a process known as sheer stress.

When standing on Thorpness beach, it is possible to envisage how these elements interconnect to facilitate erosion on this dynamic, fragile stretch of coastline.

Wire from damaged flood defence with pieces of wool caught in the ends.

Storm Beach

As high winter waves on the Suffolk coast continue to be recorded at Lowestoft, with Storm Barra, on the 7th December, seeing a maximum wave height (MWH) of 6 metres with a significant wave height (SWH) of 3.37 metres. This discussion will consider the definition that a SWH of 3.11 metres or above, with a return period of four times a year, has the potential to move significant amount of beach material.  Wave data is from Coastal Monitoring.org.

As a focus for a discussion of what it means for storm waves to move significant amounts of beach material, a beach near Thorpeness, that has undergone considerable erosion in recent years will be considered. An emergency flood defence, in the form of a 35-metre rock revetment was installed in October 2021 at the northern end of Thorpeness beach in a partnership between Coastal Partnership East (CPE) and the Water Management Alliance. CPE believe Thorpeness experienced “more intense levels of coastal erosion” last winter and this prompted the emergency response.

A 35-metre Rock Revetment installed at northern end of Thorpeness beach in Suffolk. Photo taken January 1st 2022.

A number of flood defences have been constructed, over the years at this section of beach including wire-filled gabion baskets installed in the 1970s, and geotextile bags and small rocks installed in May 2021 as a short-term solution. However, recent powerful storms have demonstrated just what a hard job coastal flood authorities face, to manage ongoing erosion. Photos taken less than 6 weeks apart show significant damage to the bags and rock cages. Firstly, a photo taken on November 21st 2021, shows the intact bags and cages.

Rock cages on Thorpeness Beach, November 21st 2021

Whilst a photo taken on January 1st 2022, shows the damage caused by storm waves to the flood defences.

Rock Cages and Bags showing storm damage on Thorpeness Beach, January 01 2022

Secondly, at the area of beach, subject to the most severe erosion, a photo taken on November 21st 2021, shows scouring at the base of cliffs.

Scouring at the base of cliff on Thorpeness beach, November 21st 2021

A subsequent photo shows how a vertical landslip down the face of the cliff, has caused a large square piece of concrete to fall from the top of the cliff. Descriptions of erosion processes do say that scouring at the base of a cliff can ultimately lead to a land slip of the cliff above, but in this specific case, it is not possible to establish a causal link.

A landslip that has caused a large piece of concrete to fall from the cliffs on Thorpeness Beach, January 1st 2022.

Thirdly, two photos give a wider view of houses at the top of the cliff with a view to the newly installed flood defences.

View of Thorpeness beach with houses at top of cliffs, newly installed flood defences and Aldeburgh Martello Tower, November 21st 2021.
View of Thorpeness Beach with houses on top of cliff, recently installed flood defences and Martello Tower in background, January 1st 2022

The later photo above seems to show how erosion has stripped back the surfaces at the base of the cliff. It is also interesting to note how much shingle has been removed from the beach and how much the remaining ridge of shingle has been pushed back up the beach.

Damaged flood defences on Thorpeness beach with view of how far remaining shingle ridge has been pushed up the beach, January 1st 2022.

Future discussions will consider the history of flood defence approaches on this dynamic stretch of coastline, and examine the erosion processes that continue to alter beaches and cliffs.

High October Waves

As the coast enters the winter storm season, it is useful to analyse wave patterns on the Suffolk coast and consider recent incidences of considerable wave height. The location of the wave measurements is Lowestoft, where wave data is monitored using a Datawell Directional WaveRider Mk III buoy. The buoy is owned by the Environment Agency, and it was first deployed on 20th April 2016. The source of the data is coastalmonitoring.org.

Waves breaking on the beach at Orford Ness, Suffolk

Consideration of wave data will focus on significant wave height (SWH), defined as the average height of highest one-third of all waves measured. SWH will be considered in relation to maximum wave height (MWH), the highest wave within a wave measuring period. SWH and MWH for the month of October 2021 will be analysed alongside the dominant wave period (DWP), the Tpeak (seconds). This refers to the wave period where the highest wave energy is centred and observing DWP can enable analysis of whether a wave is a product of local winds, or a product of a swell. If the DWP and wave height roughly match each other, this can indicate storm conditions.

Waves and Spray, Orford Ness, Suffolk

The charts which record wave height data on coastalmonitoring.org, have a red line which runs horizontally, which indicates the storm alert threshold. SWHs above this line can be considered to be a product of storm conditions. Additionally, these waves can be analysed in relation to their return period, whether are relatively common, with a likely return period of four times a year, or whether the SWH has a return period of every 50 years, or a hundred years. The chart on coastalmonitoring.org, for Lowestoft, has a storm alert threshold height of 3.11 metres, with a return period of four times a year. To analyse SWH and MWH in more detail, data from 2nd October 2021 will be considered. On this date, a SWH of 3.64 metres and a MWH of 6.83 metres were recorded.

Wave Height Data from Lowestoft recorded by the Datawell Directional WaveRider Mk III buoy, owned by the Environment Agency. Source of data, coastalmonitoring.org

For the purposes of analysing the high wave data on 2nd October in relation to the Dominant Wave period (DWP), the SWH in metres will be converted into feet. Therefore, on this date, the SWH was 12 ft and the DWP, T-Peak (S), was 8.3 seconds. However, to determine the extent of storm conditions it is useful look at the wave measurements before and after the highest SWH.

Wave Height and T-Peak (S) data from Lowestoft recorded by the Datawell Directional WaveRider Mk III buoy, owned by the Environment Agency. Source of data, coastalmonitoring.org

It is interesting to note that the figures for the DWP are very near the height in feet of the SWH. It is acknowledged that when the figures correspond in this way, it is indicative of storm conditions. This would also suggest that waves were forming in a wind-wave environment. As can be seen from the chart showing the SWH and the MWH, the increase in the SWH rises as the MWH reaches its peak. Though the highest SWH was recorded just after the measurement for the highest MWH.

The MWH of 6.83 metres (22 ft) was the highest MWH recorded in October 2021, though MWHs of 6.13 m (20 ft) and 5 m (16 ft) were recorded on 31st October 2021. Though the highest SWH on this date only reached 2.92 metres (10 ft). Instances of MWH over 5 metres are clearly concerning, particularly, if they show signs of an increase from what has been previously recorded for a particular time period. However, the MWH is the height of individual peak waves, whilst SWH is the average height of the highest one-third of all waves measured. As this can be considerably lower than the MWH in any period, the SWH is of interest to coastal engineers, because the storm alert threshold for SWH has a return period of four times a year. Therefore, if the SWH is above this threshold, it could indicate the presence of waves capable of moving potentially significant amount of beach material.

A future discussion will consider this point in more detail by examining a stretch of coast at Thorpeness, in Suffolk which is currently experiencing severe beach erosion, which poses a danger to houses stationed very close to the edge of the eroding cliffs.

Waves breaking on Aldeburgh beach, with Thorpeness in background.

Wall Erosion – Hazelwood Marshes

Recent information from the Alde and Ore Community Partnership has found the remaining walls at Hazelwood marshes could be at new risk of erosion. This is due large volumes of tidal water forming waves, which when driven by northerly winds risk weakening the rear inland side of the walls.

Flowers with breached walls in background at Hazelwood marshes

It is thought that there is a dual relationship between the walls being subject to increased erosion and the presence of increased amounts of tidal water at Hazelwood marshes. As the walls weaken, tidal volumes increase in the marsh, which can then lead to increased wave activity impacting the walls at Hazelwood marshes.

Original sea walls, showing signs of erosion at Hazelwood Marshes

Brian Upson owns a boatyard at Slaughden Quay, Aldeburgh, on the bend of the Alde Ore estuary, on a narrow strip of land and shingle, bordered by the open sea on one side and the estuary on the other. Mr Upson believes the tide prism increased once the walls at Hazelwood marshes were breached and was allowed to become intertidal without further intervention.

Slaughden Quay, Alde Ore Estuary

Following the breach at Hazelwood, the boatyard had to go up a buoy size, to keep the boats tethered. The tide could be 8ft at Aldeburgh, in the open sea, 10 ft at Shingle Street, at the mouth of the Alde Ore Estuary, and at Slaughden, the tide could be 9ft. Mr Upson has observed that 3 or 4 ft has been taken off the mud flats, with the disappearance of mud from the bottom of the estuary.

However, the increase in tidal flow at Slaughden is not quantified. A report by Kenneth Pye, on the 2nd May 2014, 5 months after Hazelwood marshes was breached, concluded that there would only be an increase of the tidal prism of around 6-7%, should Hazelwood marshes be left to become intertidal, with no work done to repair breached estuary walls. The tidal prism is the volume of water that comes in and out of an estuary with the rise and fall of a tide.

A cursory look at the tide levels on tidetimes.org.uk and https://www.thebeachguide.co.uk/south-east-england/suffolk/shingle-street-weather.htm, shows that on Sunday 3rd October, for the years, 2021 back to 2019, the height of the tide at Slaughden, either slightly exceeded the height of the open sea at Aldeburgh, or was slightly below it, with the height of the tide at Shingle Street exceeding both of the height of the open sea at Aldeburgh and the tide height at Slaughden.

Graph showing tide tide times at Aldeburgh, open sea, Shingle Street, at the mouth of the Alde Ore Estuary and at Slaughden Quay

The height of the tide is in metres and as can be seen, there is a difference of around 2 hours between high tide at Aldeburgh in the open sea and high tide and Slaughden Quay in the Alde Ore estuary.

Wave breaking on Aldeburgh beach

Regardless of whether an increase in the tidal prism has occurred and the extent to which it is intensifying, what is noticeable is the small signs of increased erosion around the edges of Hazelwood marshes, away from the breached walls at the sea ward entrance to the marshes.

As has been discussed previously on this blog, scouring continues, into the path on the way to the bird hide.

Scouring into path and algae at Hazelwood marshes

Scouring is also occurring into the grass bank at the back of Hazelwood marshes, near a small number of houses.

Scouring into soil at foot of grass bank, Hazelwood Marshes

These dwellings are also adjacent to the river part of Aldeburgh golf course, and not far from the main Saxmundham road into Aldeburgh. This could indicate that a question of how to manage sea water volumes in intertidal areas, is something that will need to be considered in the near future.

Alteredmarshes – Anniversary

It is just over a year since this blog first began exploring coastal erosion on the Suffolk coast, with a specific focus on the area around the Alde Ore estuary.

Regular observations have been made of indicators of the impact of the sea, on shorelines, embankment flood defences, and nature reserves such as Hazelwood, the original inspiration for this blog. The reserve is both an example of what can happen when flood defences breach, but also how an intertidal reserve can develop and evolve.  

Particular areas have been chosen as they either represent frontline meeting points with wave energy and sea levels, or they provide examples of the erosive properties of salt water on estuary defences or reserve paths and perimeters. Each area is different with its own characteristics, and each can offer unique contributions to a study of coastal erosion.

On the open coast, Aldeburgh and Sudbourne Beach, serve as dynamic examples of the power of the sea to shift shingle and overtop urban sea defences, as they inhabit the shifting thin line between the sea and the Alde Ore Estuary.

Shingle on Sudbourne Beach and Saltmarsh on the edge of Alde Ore Estuary

Away from the boisterous activities of the North Sea, but impacted by it on a daily basis, Iken cliff is a peaceful wide expanse of the Alde Ore estuary. It seems a far cry from the turmoil of storm tides that have breached the old flood defences and threatened Iken cliff defences, but the area is of interest, because of the relatively high tides, in the upper reaches of the Alde Ore estuary, some distance from its mouth.

High tide, Iken Cliff, Alde Ore estuary

Another peaceful area, observed on a regular basis is the freshwater nature reserve, on Iken marshes, below the Alde Ore mud flats. Bearded Tits inhabit the Reed beds and Lapwings, nest on the marshes in the summertime. Embankment clay flood defences separate the estuary from the reserve and provide a useful example of how established saltmarsh can mitigate wave action. It is also possible to see, where the embankment is not fronted by saltmarsh, the high tide level marks, and how erosion of the concrete revetment could wear away at the base of the flood defence.

Flood defence with exposed concrete revetment alongside flood defence fronted by Saltmarsh

Finally, Hazelwood marshes provide a constant inspiration, a thriving intertidal nature reserve, whose growing biodiversity and sediment accretion, develop in the former freshwater channels and on the raised nesting islands built for nesting avocets and shell ducks and spoonbills. Erosion can be seen on the path near the bird hide.

Scouring of path, leading to bird hide, Hazelwood Marshes

However, new growth of saltmarsh can be seen on the main marsh, which could contain wave energy on the marshes.

New vegetation, growing on Hazelwood Marshes

The features of each area continue to provide interest and are worthy of continued observation, but one factor that has been present, that has not yet been discussed, is the tidal prism and the velocity of the tides. Additionally, wave heights in the open sea, and how these could impact the coast and the estuary, are also relevant to observations of coastal erosion on the Suffolk coast. The term Tidal Prism refers to the volume of water that enters and leaves an estuary with the rise and fall of a tide. The velocity of the tides describes the currents and the energy of the tides as they ebb and flow. Wave heights out at sea, at specific points where they are monitored, can also give an indication of how under storm conditions, wave activity could move shingle, altering beach structures, and contribute to erosion. Therefore, the focus of the blog in the near future, will be to examine the characteristics of the tides, in the estuary and the open sea, and discuss how these elements shape the areas under observation.

Waves on beach at Orford Ness